
Figure 8. Global acetylation levels are not altered in cells expressing Hmgn3a or Hmgn3b.
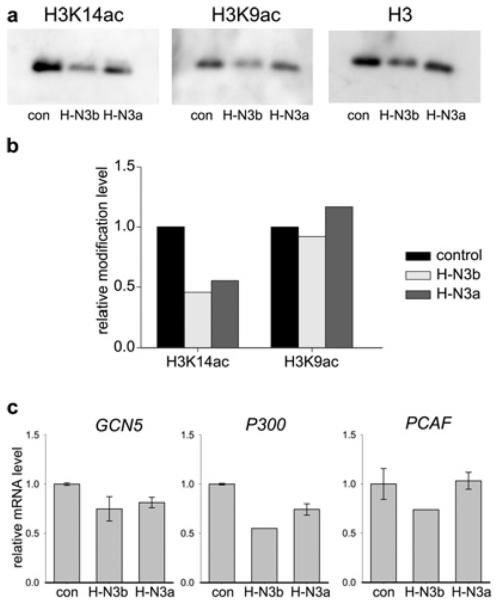
(a) Western blots of chromatin from control, H-N3b and H-N3a cells, probed with antibodies against H3K14ac, H3K9ac or histone H3. (b) Band intensities from the blots in (a) were normalized to those of H3, and modification levels are plotted relative to those in control cells. (c) Expression of the HATs Gcn5, p300 and Pcaf in the different cell lines was quantified by real-time quantitative PCR. Expression was normalized to Gapdh and is plotted relative to that in control cells.