
Figure 2.
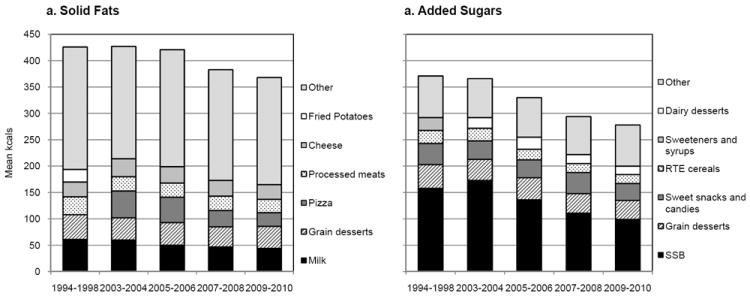
Major sources of solid fats and added sugars among children and adolescents in the United States (2-18 years) from 1994-2010a
a Data sources: Data from the Continuing Survey of Food Intakes by Individuals (CSFII) of 1994-1998 (n=8,259), What We Eat in America (WWEIA) National Health and Nutrition Examination Survey (NHANES) 2003-2004 (n=3,435), WWEIA, NHANES 2005-2006 (n=3,652), WWEIA, NHANES 2007-2008 (n=2,594), WWEIA, NHANES 2009-2010 (n=2,763).