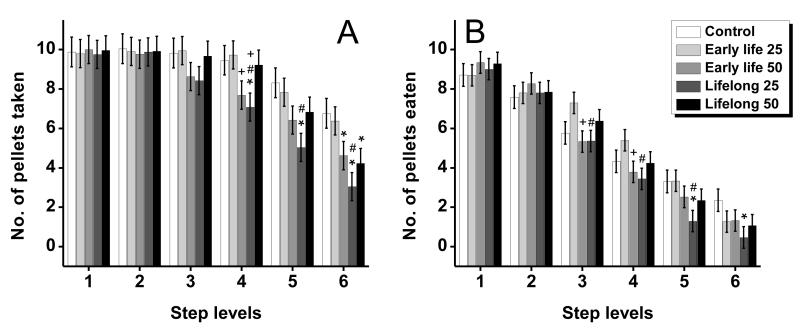
Figure 5.
(A) Number of 20 mg pellets taken, and (B) number of pellets eaten by the control and Mn-exposed groups, as a function of step level (reaching difficulty) of the staircase. Bars represent the mean ± S.E. (n=11-12/group). * indicates p<0.05 versus control; ‘#’ indicates p<0.05 versus the early life Mn exposure group within each Mn dose level; ‘+’ indicates p<0.05 for the 25 mg Mn/kg/d group versus the 50 mg Mn/kg/d group within each level of exposure duration. Manganese doses in mg Mn/kg/d (see text).

