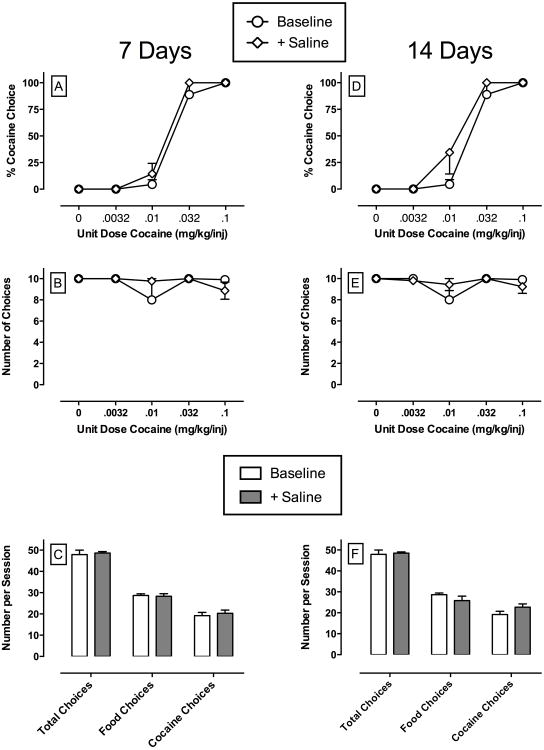
Figure 1.
Effects of continuous 14-day treatment with saline on choice between cocaine and food in rhesus monkeys (n=3). The top panels show saline treatment effects on cocaine dose-effect curves. Top and middle abscissae: unit dose of cocaine in milligrams per kilogram per injection (log scale). Top ordinates: percent cocaine choice. Middle ordinates: the number of choices completed per component. The bottom panels show summary data for total choices, food choices and cocaine choices summed across all cocaine doses. Bottom abscissae: experimental endpoint. Bottom ordinates: number of choices per session. All points and bars represent mean data ± SEM obtained during days 5-7 and 12-14 of each 14-day treatment period from three monkeys. Baseline points and bars represent mean data ± SEM obtained during the 3 days preceding each treatment period while saline was infused through the “treatment” lumen of the double lumen catheter.

