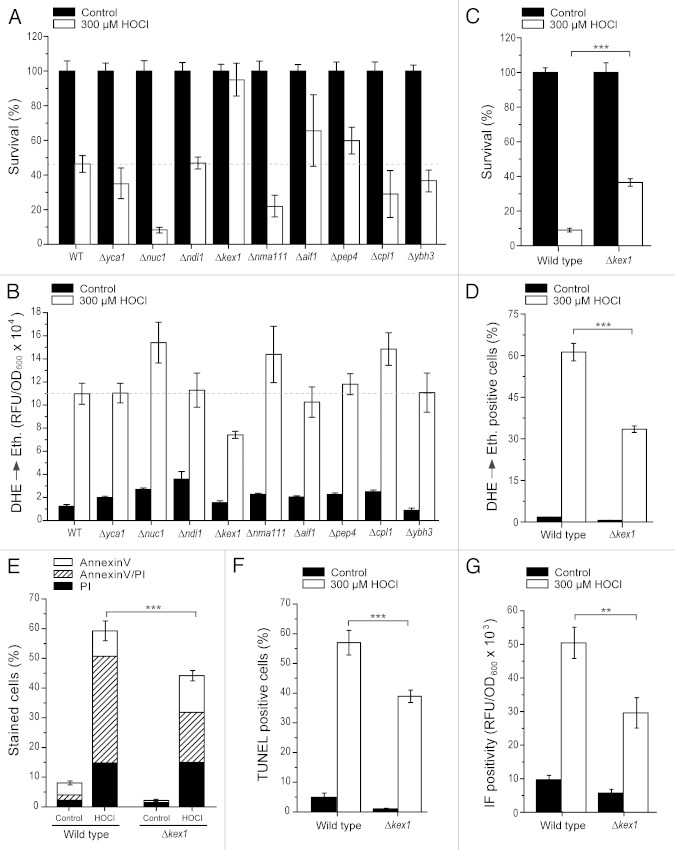
Figure 2. The protease Kex1p is involved in HOCl-induced cytotoxicity. (A and B) Survival (A) and ROS production (B) of wild type, Δyca1, Δnuc1, Δndi1, Δkex1, Δnma111, Δaif1, Δpep4, Δcpl1 and Δybh3 cells after treatment with or without 300 µM HOCl for 16 h as determined via clonogenicity (A) and DHE→Ethidium conversion (B), respectively. Survival (A) was normalized to the untreated control. Experiments in (B) were quantified using a fluorescence plate reader. Data represent means ± s.e.m. (n = 8 – 16). The dashed line draws the survival (A) and ethidium fluorescence (B) levels of the HOCl-treated wild type, respectively. RFU, relative fluorescence unit. (C–F) Survival (C), ROS production (D), phosphatidylserine externalization (E), loss of membrane integrity (E) and apoptotic DNA fragmentation (F) of wild type and Δkex1 cells after treatment with or without 300 µM HOCl for 16 h as determined via clonogenicity (C), DHE→Ethidium conversion (D), Annexin V/PI co-staining (E) and TUNEL staining (F). Data represent means ± s.e.m. (n = 8; ***, p < 0.001). Survival (A) was normalized to the untreated control. In each experiment for (D–F), 30,000 cells were evaluated using flow cytometry. (G) Fluorescence intensity of wild type and Δkex1 cells after treatment with or without 300 µM HOCl for 16 h and subsequent immunofluorescence (IF) staining using mAb 2D10G9 as a primary antibody and quantified using a fluorescence plate reader. Data represent means ± s.e.m. (n = 9; **, p < 0.01). RFU, relative fluorescence unit.

An official website of the United States government
Here's how you know
Official websites use .gov
A
.gov website belongs to an official
government organization in the United States.
Secure .gov websites use HTTPS
A lock (
) or https:// means you've safely
connected to the .gov website. Share sensitive
information only on official, secure websites.
