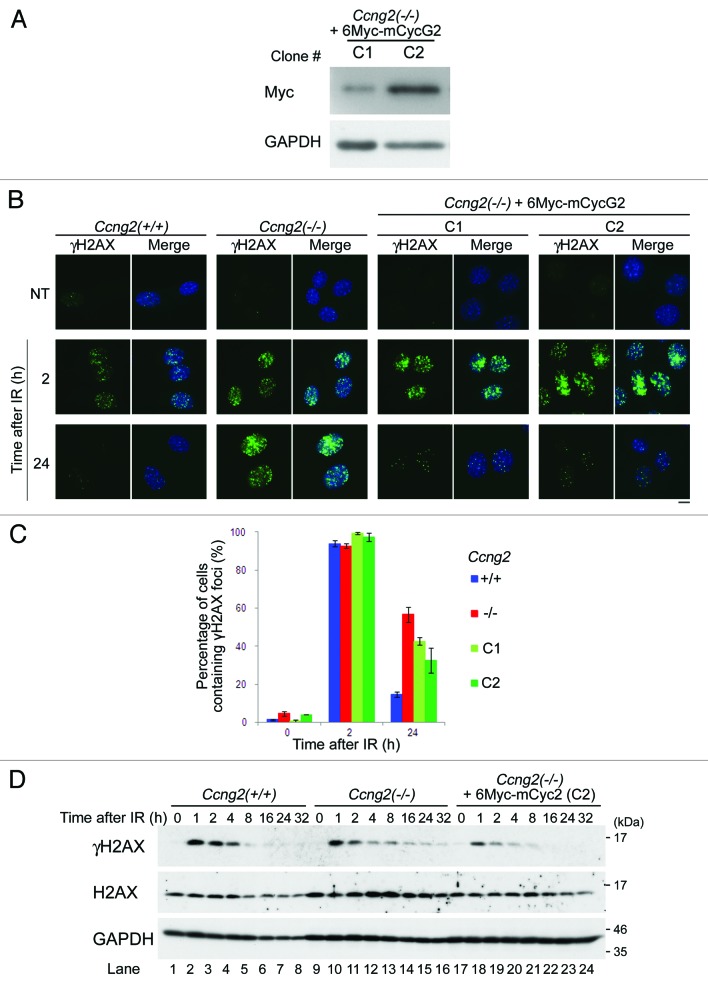
Figure 4. Exogenous expression of mCycG2 in Ccng2−/− MEFs rescues the dephosphorylation of γH2AX. (A) Western blot analysis of exogenous mCycG2 expression in Ccng2−/− MEFs stably expressing 6Myc-mCycG2. (B) Representative images of wild-type MEFs, Ccng2−/− MEFs or Ccng2−/− MEFs expressing 6Myc-mCycG2 stained with an anti-γH2AX antibody at various time points following IR. DNA was stained with Hoechst 33258. Bar = 10 μm. (C) The graph indicates the percentage of cells containing γH2AX foci at various time points following IR. Data were calculated as described in the legend to Figure 3F. The error bars denote the SD. (D) Changes in H2AX phosphorylation at various time points after IR. Western blotting was performed using anti-γH2AX and anti-H2AX antibodies. GAPDH was used as a loading control.

An official website of the United States government
Here's how you know
Official websites use .gov
A
.gov website belongs to an official
government organization in the United States.
Secure .gov websites use HTTPS
A lock (
) or https:// means you've safely
connected to the .gov website. Share sensitive
information only on official, secure websites.
