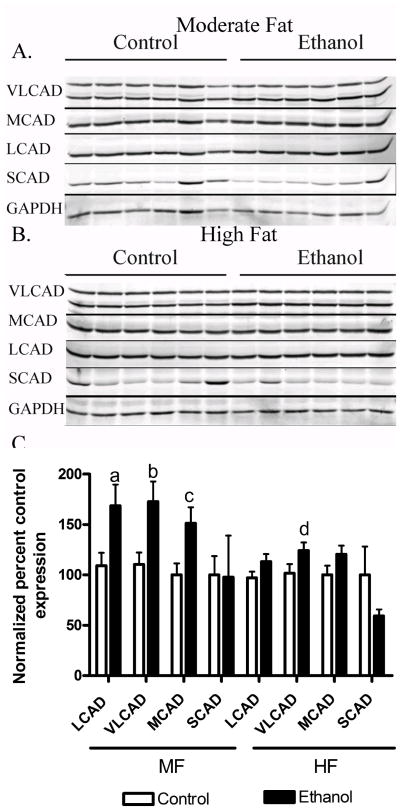
Fig 4.
Effects of increasing dietary fat and ethanol on mitochondrial fatty acyl-CoA dehydrogenase expression. Whole cell lysates from both MF and HF control and ethanol groups were analyzed via standard immunoblotting and probed for VLCAD, LCAD, MCAD and SCAD expression using polyclonal antibodies. (A) MF+E, (B) HF+E, (C) Quantification of the Western blots (GAPDH normalized). Data are means± SEM as analyzed by two-way ANOVA with a Bonferroni post hoc analysis (MF±E compared to HF±E groups). Means without a common superscript letter are significantly different (N=6 mice/group (p<0.05)).

