
Figure 4. Fungal burden and distribution in kidneys infected with C. parapsilosis.
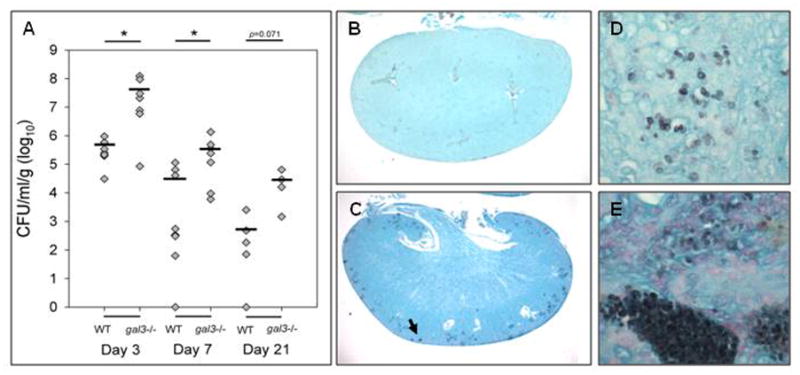
WT and gal3−/− mice were infected with 1×10⁸ CFU of C. parapsilosis via tail vein injection. (A) Fungal burden of kidneys of WT and gal3−/− mice; 3, 7 and 21 days post infection. Bar represents mean CFU. Comparisons of fungal burdens were made by Wilcoxon rank-sum test, *p<0.05. Low magnification view of GMS stained kidney sections of infected WT (B) and gal3−/− (C) mice 3 days post infection. Fungal elements appear black. Black arrow indicates dense area of yeast. Higher magnification (×600) of yeast of infected WT (D) and gal3−/− (E) mice demonstrating yeast present in renal parenchyma.