
Figure 6. Fungal burden, fungal distribution, and histopathology of brains infected with C. albicans.
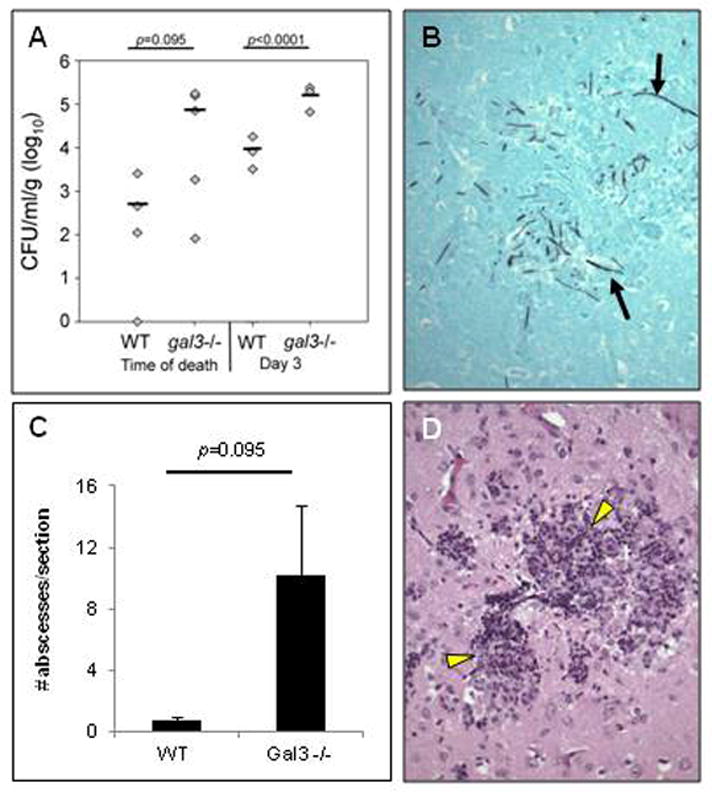
WT and gal3−/− mice were infected with 1×10⁵ CFU of C. albicans via tail vein injection. (A) Brain fungal burden from WT and gal3−/− mice at time of death and at day 3 post-infection. Bar represents mean CFU. (B) High magnification (×200) of GMS stain of brain section from an infected gal3−/− mouse at time of death. Black arrows indicate hyphae. (C) Number of brain abscesses per section from WT and gal3−/− mice at time of death. Results are means ± SEM. (D) High magnification (×200) of H&E stained brain section of gal3−/− mice at time of death. Yellow arrow heads indicate abscesses. Comparisons of fungal burdens and abscesses were made by Mann-Whitney rank-sum test when there were sufficient cases for ranking, or a negative binomial model where group n=3.