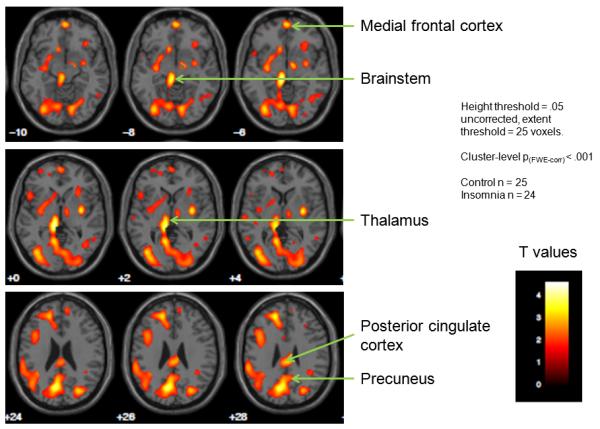
Figure 3.

Subtraction images of [18F]-fluorodeoxyglucose positron emission tomography (FDG PET) scans conducted in participants with chronic insomnia and good sleepers. Participants in each group had FDG PET scans during morning wakefulness and the first non-rapid eye movement sleep (NREMS) period. Statistical Parametric Mapping version 8 was used to examine the interaction of sleep-wake state with participant group. The images above indicate areas in which the wake-NREMS differences were smaller for participants with chronic insomnia versus controls. Relatively smaller wake-sleep changes were observed for insomnia participants in regions related to introspective, self-focused mental activity (precuneus, posterior parietal cortex), emotion regulation (medial frontal cortex) and sleep-wake regulation (thalamus, brainstem). The color scale corresponds to t values for individual voxels in the SPM comparison. Height extent = threshold value for considering voxels significantly different. Extent threshold = number of contiguous voxels required to consider a cluster of voxels significantly different.
