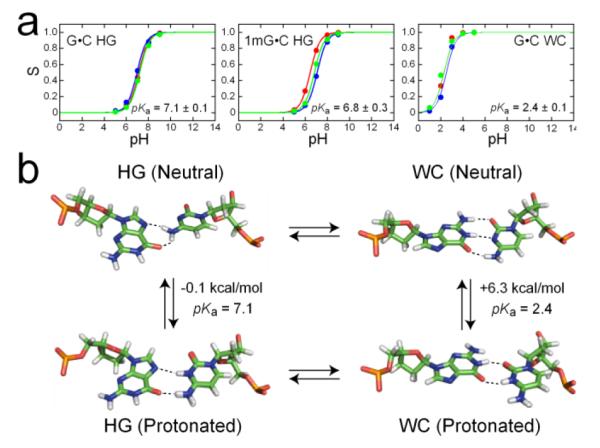
Figure 3.

Constant pH MD simulations of WC and HG base pair protonation. (a) Titration curves obtained from 3 independent runs of single-site CPHMDMSλD simulations of a G•C HG base pair, its 1mG analog, and a G•C WC base pair. (b) Corresponding structures for the neutral and protonated WC and HG base pairs and predicted free energy differences at pH 7, depicted in the context of the proposed 4-state equilibrium.
