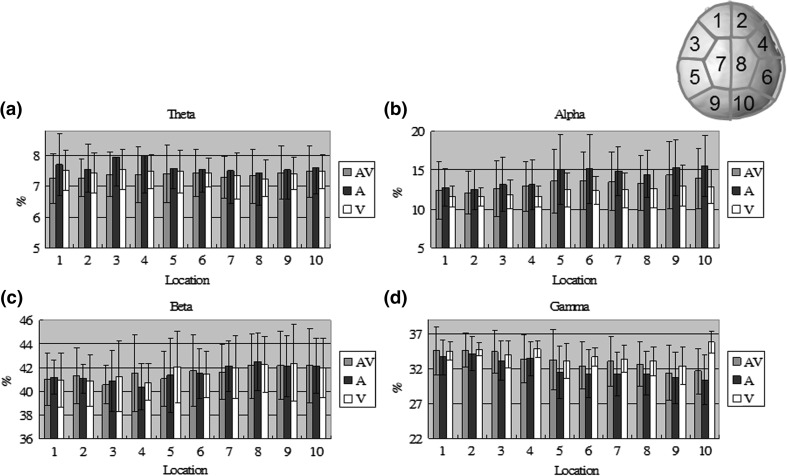
Fig. 2.
Mean values of the a theta, b alpha, c beta, and d gamma activity from the ten subjects to Ap, Vp and ApVp modalities in ten different regions. Each bar represents the percentage ratio between power in one frequency band and total power across all bands for one modality. The location numbers correspond to a top view of the brain with labels in the upper-right corner

