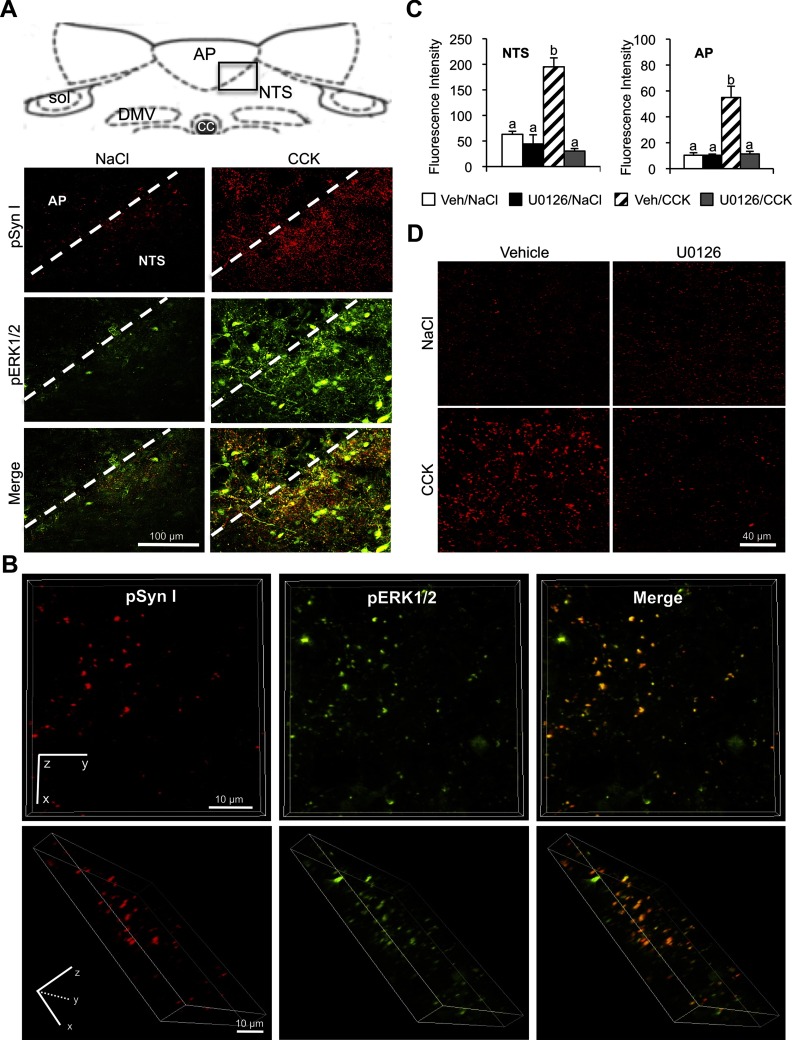
Figure 2.
Relation of CCK-induced synapsin I phosphorylation to ERK1/2 phosphorylation. A, Dual-label immunofluorescence images (×40 magnification) illustrating anatomical overlap between pERK1/2 and pSyn immunoreactivity in the neuropil of the AP and NTS after CCK (2 μg/kg) treatment (right column) but not after control saline injection (left column). The boxed region in the diagram of the dorsal hindbrain indicates the area included in the fluorescent images below. DMV, dorsal motor nucleus of the vagus; NTS, nucleus of the solitary tract; sol, solitary tract. B, Three-dimensional images rendered from high-magnification (×100) optical sections (24 sections 0.5 μm apart for a total thickness of 12 μm) showing colocalization of pERK1/2 and pSyn in the NTS. The top row is a view from the z-plane and the bottom row is a rotated view of the same rendering. C, Average fluorescence intensity of pSyn in NTS and AP of rats treated with fourth ventricle u0126 (4 μg) or vehicle prior to an ip injection of CCK (2 μg/kg) or saline. Data are means ± SEM. Means sharing a common letter are not differ significantly. D, Representative images of dorsal hindbrain sections stained to reveal pSyn immunoreactivity in NTS of rats treated with a fourth ventricle injection of the MEK inhibitor, u0126 (4 μg) or vehicle prior to an ip injection of CCK (2 μg/kg) or saline. Column labels indicate fourth ventricle treatment and row labels indicate the ip treatment condition.

