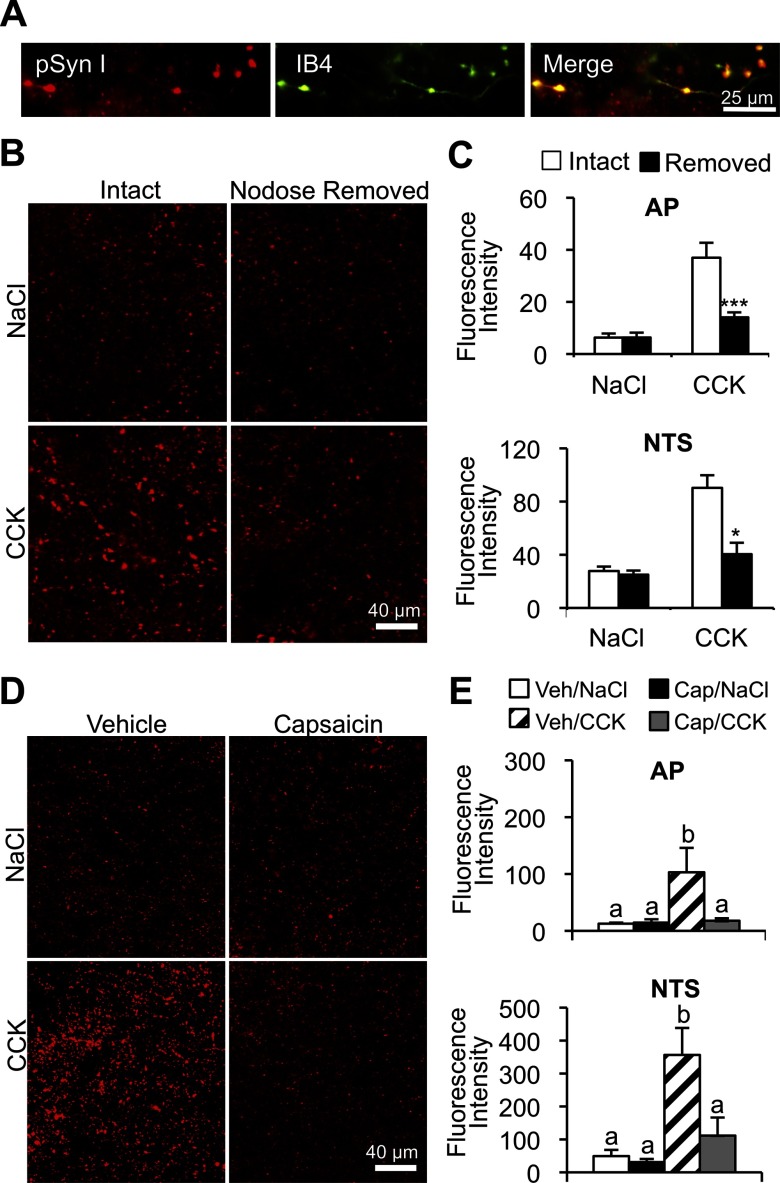
Figure 3.
Localization of CCK-induced pSyn in vagal afferent C-type endings. A, Magnification image (×100) of multilabel fluorescence hindbrain images stained to reveal pSyn (red) and IB4 binding (green). Far right image depicts overlap of the 2 labels. B and C, Representative images of CCK-induced pSyn immunoreactivity in NTS after the unilateral nodose removal. Column labels indicate NTS ipsilateral (nodose removed) or contralateral (intact) to nodose ganglion removal. Row labels indicate treatment conditions ip CCK or NaCl. Data are means ± SEM. *, P < .05; ***, P < .001. D, Representative images depicting CCK-induced pSyn immunoreactivity in the NTS of rats pretreated with capsaicin or vehicle. Row labels and column labels indicate experimental conditions (2 μg/kg CCK or saline administered ip). E, Average fluorescence intensity of pSyn in the NTS and AP of capsaicin- and vehicle-treated rats 15 minutes after ip injection of CCK or NaCl. Data are means ± SEM. Means sharing a common letter do not differ significantly.

