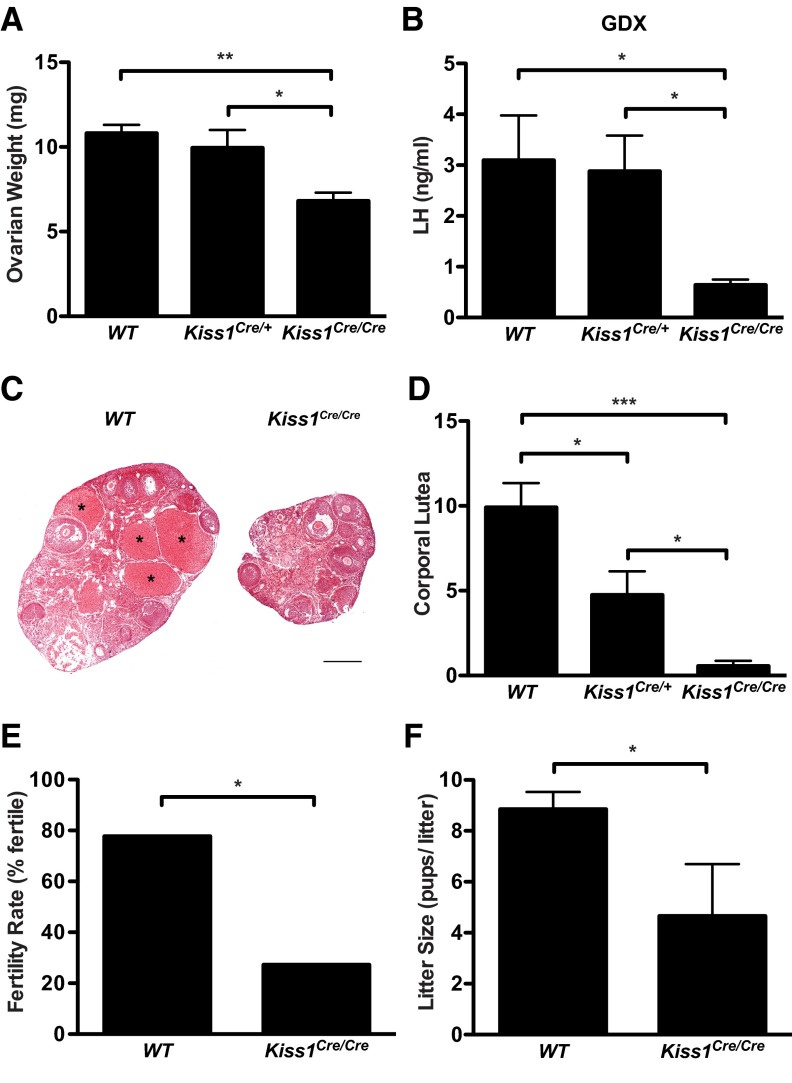
Figure 6.
Phenotype of adult Kiss1Cre/Cre females. A, Combined ovarian weight (n = 6-8). B, LH in OVX mice (n = 6-8). C, Photomicrographs from WT (left) and Kiss1Cre/Cre (right) ovaries. Scale bar, 500 μm. *, CL. D, Mean number of CL in both ovaries obtained by averaging 2 sets of sections from each ovary analyzed by 2 experimenters blind to genotype (n = 6-7). E, Percentage of females that are fertile of all females paired with WT males (n = 9-11). (It is not possible to calculate error bars from a percentage). F, Mean number of pups per litter includes only data from females that had pups (n = 3-7). *, P < .05; **, P < .005; ***, P < .0001 by 1-way ANOVA with Tukey's multiple-comparison test (A, B, and D), Fisher's exact test (E), and 2-tailed t test (F).

