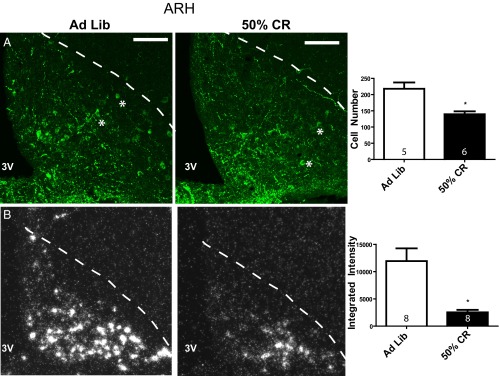
Figure 4.

Arcuate nucleus CART protein and mRNA levels during CR. (A) Confocal photomicrographs of immunohistochemistry for CART protein (Phoenix antibody, H-003–62) in the ARH (location denoted by dotted line) in ad libitum fed and 50% CR animals (100 μM scale bar provided). Quantification of the total number ARH CART cells in 4 sections per animal is provided in the bar graph. (B) Dark field silver grain photomicrographs of in situ hybridization for 35S-CART mRNA probe. Quantification of ARH CART mRNA mean integrated intensities is provided in the histogram. Group sample size is given within each histogram. 3V, third ventricle. *, examples of identified cells.
