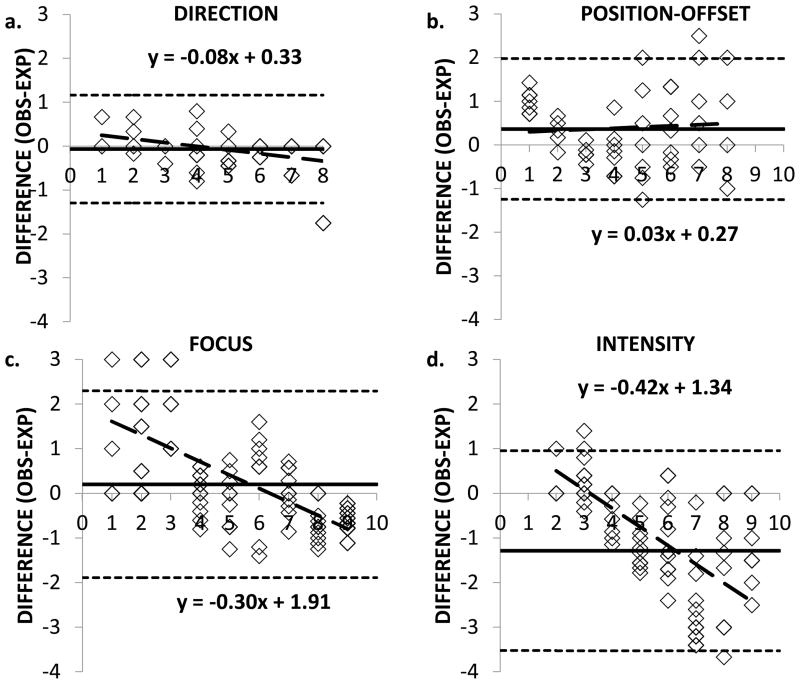
Figure 5.
Limits of agreement for the difference between the observed and expected responses for the simultaneous presentation of randomized attribute combinations for the following ghosting attributes of (a.) Direction, (b.) Position-offset, (c.) Focus, and (d.) Intensity for a 20/160 target. The symbols represent the mean difference for each subject’s five trials for each rating number in the series. The x-axis represents the expected rating on the ghosting questionnaire. The solid black horizontal line represents the mean difference score for all subjects and rating levels. The black long dashed line represents the best-fit linear regression line, and the short dashed black horizontal lines the 95% Limits of Agreement for the difference scores. Note that when the stimulus level is 1, the difference scores can range from 0 to 9, when the stimulus level is 5, can range from −4 to +5, and when stimulus level is 10, the difference score can range from 0 to −9.

