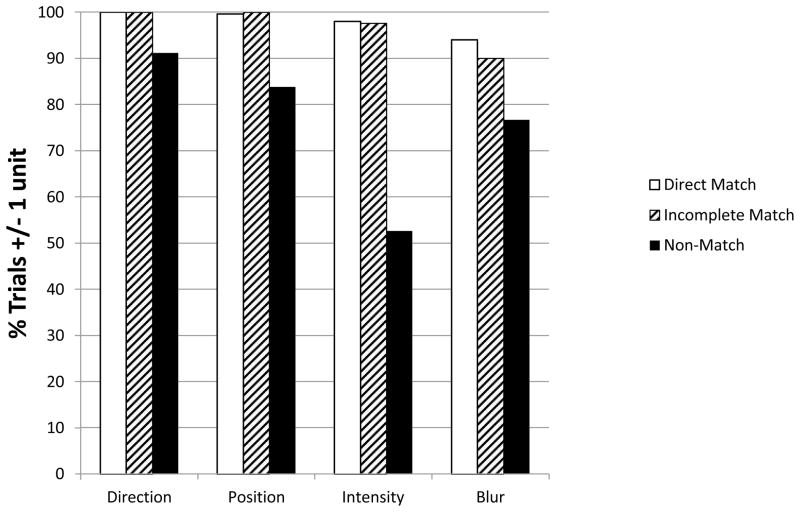
Figure 6.
Grouped barplots for each ghosting attribute depicting the percentage of trials that were within +/−1 unit for the Direct Match series (i.e., matching 20/160 images of the questionnaire to 20/160 targets on the monitor)(white bars), the Incomplete Match series (i.e., matching 20/80 images on the monitor to the 20/160 images on the questionnaire, but other stimulus aspects remained the same)(hatched bars), and the Non-Match series (i.e., simultaneous presentations of random combinations of all stimulus dimensions of 20/160 letter sizes)(black bars).

