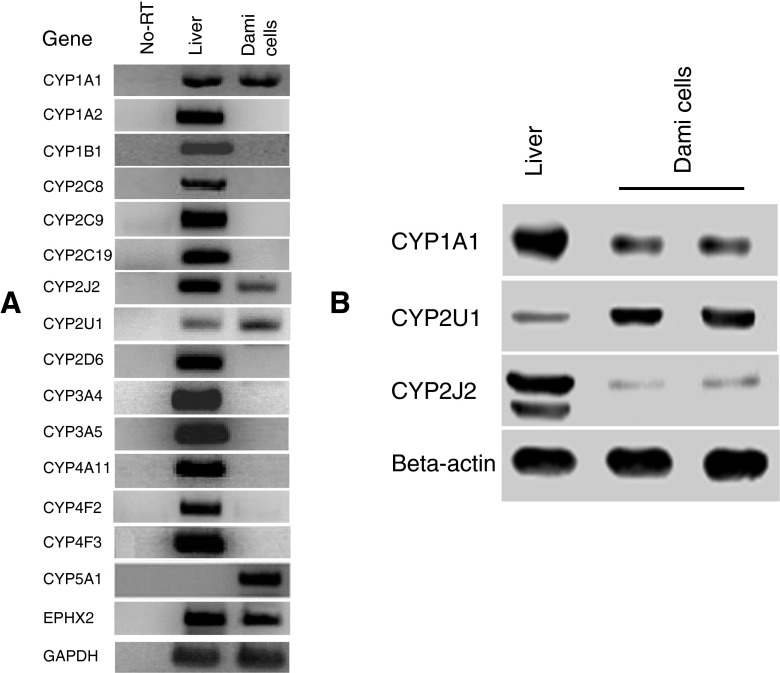
Figure 1.
Expression profiles of P450s in Dami cells. (A) RT-PCR was used to amplify each P450 with the specific primers listed in Table 1. The targeted genes were amplified as a single product of the expected size; no bands were detected in control samples in which the PCR was performed in RNA samples without reverse transcriptase treatment to confirm that there was no genomic DNA contamination. Liver tissue cDNA was used as a reference control for P450 detection. EPHX2, epoxide hydrolase 2. (B) Detection of CYP1A1, 2U1, and 2J2 proteins in Dami cells by immunublot analysis. Total protein lysates (35 μg) from Dami cells were loaded in each lane. Lysates prepared from liver microsomes were used as a reference standard. The immunoreactivity of actin was used as a loading control. Proteins were separated on a 13% SDS-polyacrylamide gel, transferred to nitrocellulose membrane, and detected by primary antibodies against CYP1A1, 2U1, and 2J2. Protein bands were visualized by the chemiluminescence method.

