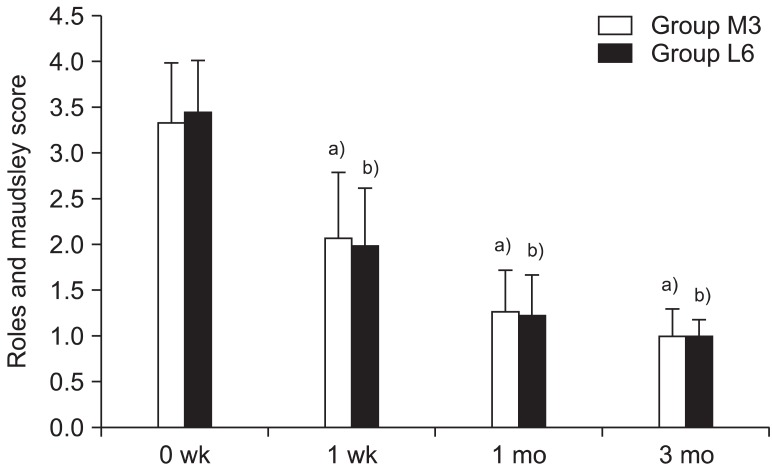
Fig. 4.
Temporal changes of Roles and Maudsley score (mean±standard deviation) at 0 and 1 week and at 1-3 months follow-up after extracorporeal shock wave therapy in the same total energy influx groups (groups M3 and L6). a)p<0.001 significantly different vs. 0 week within group M3. b)p<0.001 significantly different vs. 0 week within group L6. No significant difference between both groups (p=0.689) in Roles and Maudsley score.

