
Table 4.
Comparison of clinical parameters pre- and post-treatment
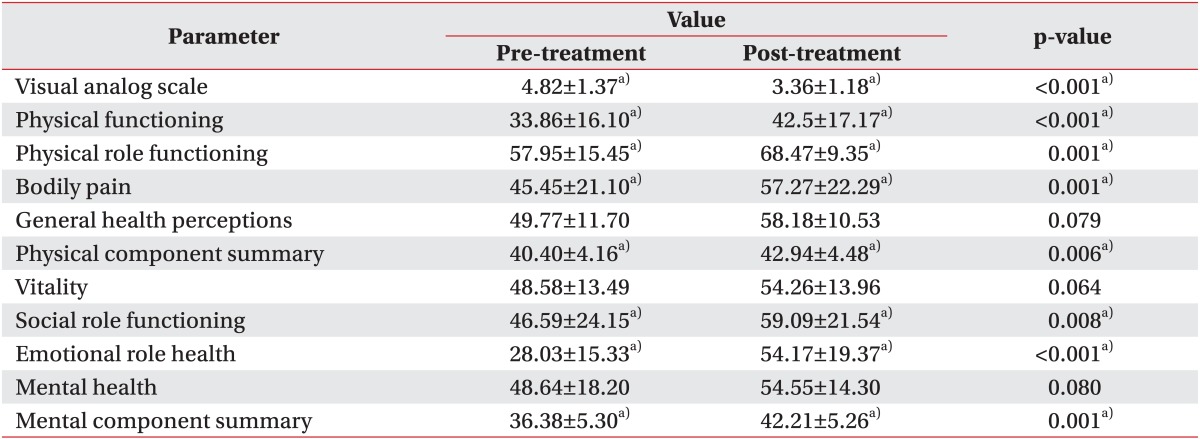
Values are means±standard deviation.
a)p<0.05, by a paired t-test comparing between before and after treatment in each group.
Official websites use .gov
A
.gov website belongs to an official
government organization in the United States.
Secure .gov websites use HTTPS
A lock (
) or https:// means you've safely
connected to the .gov website. Share sensitive
information only on official, secure websites.
Comparison of clinical parameters pre- and post-treatment
Values are means±standard deviation.
a)p<0.05, by a paired t-test comparing between before and after treatment in each group.