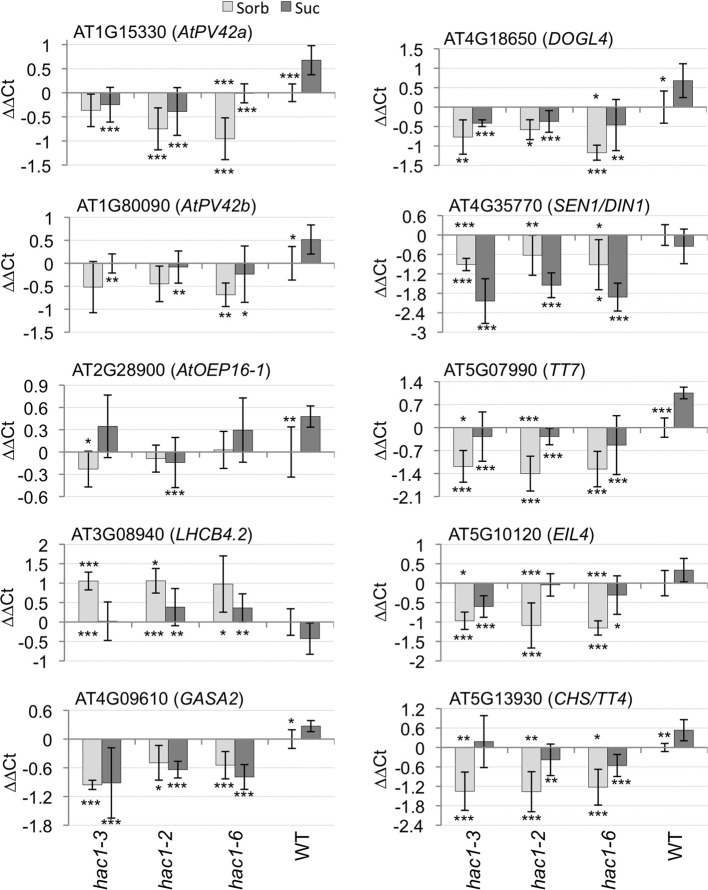
Figure 6.
Mutations in HAC1 cause altered expression of specific genes. Mutant and wild-type (WT) Arabidopsis seeds were surface sterilized and then incubated in the dark at 4°C for 3 days prior to being sown on nytex screens on Petri plates containing solid minimal Arabidopsis media. The seeds were incubated under continuous light at room temperature for 20 h, and then the nytex screens and seeds were transferred to Petri plates containing Arabidopsis minimal media supplemented with 0.1 M sorbitol (Sorb) or Suc. After an additional 12–13 h, seeds were harvested, followed by isolation of RNA. Quantitative RT-PCR was then used to measure transcript levels. The transcript levels of ACT7 and UBQ6 were determined and the geometric means of their Ct used to normalize transcript levels. Transcript levels are expressed as ΔΔCt. ΔΔCt = ΔCtindicated gene in wild-type on sorbitol – ΔCtindicated gene in indicated line on indicated media. ΔCt = Ctindicated gene in indicated line on indicated media – CtACT7/UBQ6 in same line on same media. Positive ΔΔCt values indicate that transcript levels for the indicated gene are higher in the indicated line on the indicated media than in wild-type seeds incubated on sorbitol. Conversely, negative ΔΔCt values indicate that transcript levels for the indicated gene are lower in the indicated line on the indicated media than in wild-type seeds incubated on sorbitol. Two technical replicates were performed for each biological replicate. Error bars indicate standard deviations. The results of Student's t-tests comparing transcript levels for seeds germinated on 0.1 M sorbitol vs. seeds of the same line germinated on 0.1 M Suc are indicated by asterisks above the columns indicating the average transcript levels for seeds germinated on 0.1 M sorbitol. The results of Student's t-tests comparing transcript levels in hac1 vs. wild-type seeds germinating on the same media are indicated by asterisks below the columns indicating the average transcript levels for each hac1 allele on each media. *p < 0.1; **p < 0.05; or ***p < 0.02, according to a Student's t-test. N = 4.

