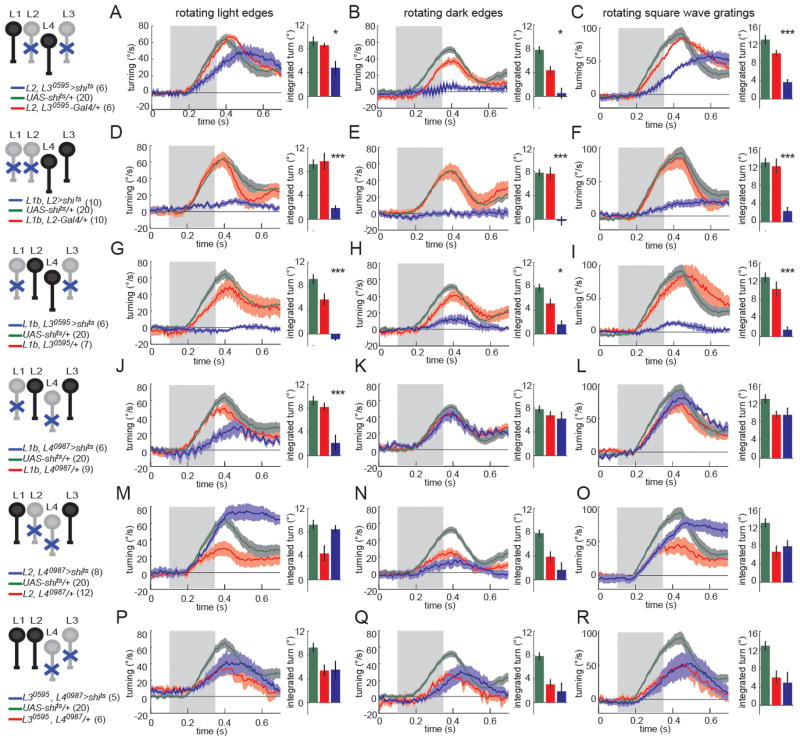
Figure 6. Circuits that compute responses to dark edge motion receive inputs from L1, L2 and L3.
(A–R) Turning behavior in response to various rotational stimuli. Each panel shows the experimental Gal4(1)+Gal4(2)>shits condition (blue) as well as the corresponding Gal4(1)+Gal4(2)/+ (red) and UAS-shits/+ (green) controls. Shading denotes +/− 1 SEM. Genotypes and schematics are shown to the left. Number of flies run per genotype is indicated in parentheses. The bar plots next to each time trace show integrated responses over a 250 ms window beginning 80 ms after stimulus onset. *p<0.05, ***p<0.001, tested using two-tailed t-tests against both controls. Error bars denote +/− 1 SEM.
(A,D,G,J,M,P) Turning responses to rotating light edges. Multiple light bars appear on a dark background. One edge of each bar then expands in the same direction at 80°/s. (B,E,H,K,N,Q) Turning responses to rotating dark edges. Multiple dark bars appear on a light background. One edge of each bar then expands in the same direction at 80°/s. (C,F,I,L,O,R) Turning responses to rotating square wave gratings with 40° spatial period and moving at a contrast frequency of 9 Hz. See also Figure S6.

