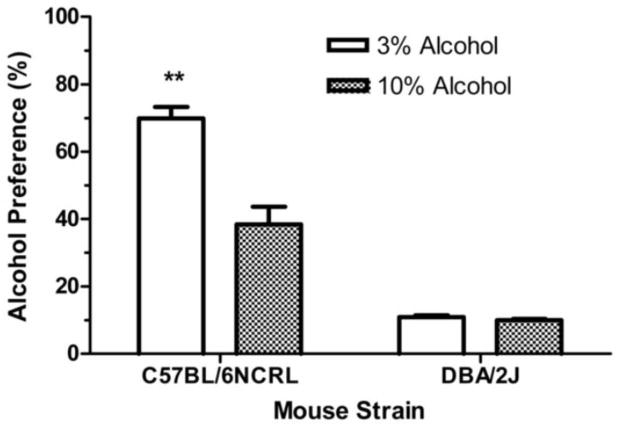
Fig. 3. Pre-abstinence alcohol preference (%).
Mean daily percent alcohol preference [(grams of alcohol fluid consumed divided by grams of alcohol fluid consumed + grams of water fluid consumed) x 100] during the last 5 sessions preceding the first abstinence period for the C57BL/6NCRL mice trained with the 3% alcohol concentration (n=24) and the C57BL/6NCRL mice trained with the 10% alcohol concentration (n=24) and for the DBA/2J mice trained with the 3% alcohol concentration (n=24) and the DBA/2J mice trained with the 10% alcohol concentration (n=24). The vertical bars represent the standard error of the mean (SEM). The double asterisk (**) indicates that the groups differed at the 0.01 level of significance.

