Figure 3.
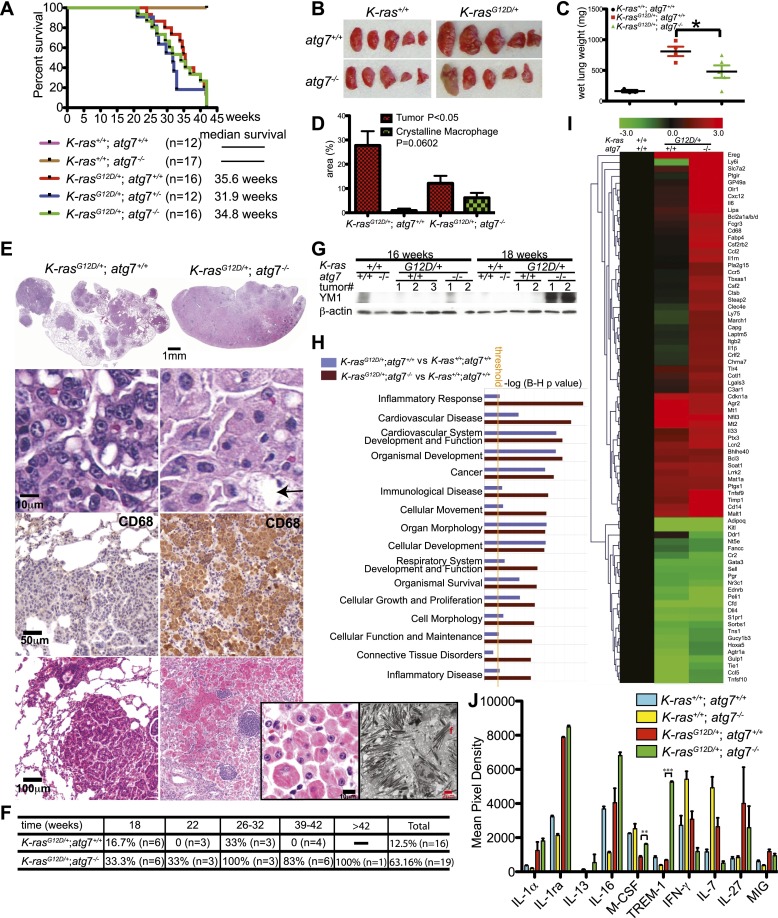
Inflammation is the major cause of death of mice bearing K-rasG12D/+;atg7−/− tumors. (A) Kaplan-Meier survival curve of mice with K-rasG12D/+ tumors that were atg7+/+, atg7+/−, and atg7−/− (P > 0.05, log-rank test). (B) Representative gross lung pathology at 42 wk after tumor initiation (n = 4 mice for K-rasG12D/+;atg7+/+; n = 5 mice for K-rasG12D/+;atg7−/−). (C) Quantification of wet lung weight from B. (*) P < 0.05 (t-test). (D) Quantification of tumor and crystalline macrophage burden in the lungs at 42 wk (n = 4 mice for K-rasG12D/+;atg7+/+; n = 5 mice for K-rasG12D/+;atg7−/−) (t-test). (E) Tumor and lung pathology at 42 wk. The top panels show representative lung lobes with K-rasG12D/+;atg7+/+ tumors or with inflammation in K-rasG12D/+;atg7−/− tumor-bearing lungs. Full scans of all lobes are shown in Supplemental Figure S3. The histology below shows typical adenocarcinoma (atg7+/+) or oncocytoma (atg7−/−) (arrow indicates necrotic cell). Below are representative IHC stainings for the macrophage marker CD68. The bottom panels show representative tumor with adjacent air sacs in mice with K-rasG12D/+;atg7+/+ tumors or inflammation in K-rasG12D/+;atg7−/− tumor-bearing lungs. The inset panels at right show representative histology and electron microscopy of crystalline macrophages in the lungs of mice with K-rasG12D/+;atg7−/− tumors. (F) The table shows the percentage of desquamative interstitial pneumonia in K-rasG12D/+;atg7+/+ and K-rasG12D/+;atg7−/− mice at the indicated times. (G) Western blot of YM1 in normal lung tissue and tumors. (H) Comparison analysis of the gene expression data showing pathways and molecular functions most significantly enriched in K-rasG12D/+ lung tumors compared with normal lung tissue (P = 0.05) (yellow line) by ingenuity pathway analysis. (I) Heat map diagram of differential gene expression in atg7+/+ and atg7−/− tumors compared with normal lung tissue. The bar represents log2-transformed fold change in signal intensities. (J) Quantification of cytokine expression levels in mouse lungs. Mouse cytokine array panels are shown in Supplemental Figure S9. (**) P < 0.01; (***) P < 0.001 (t-test).

