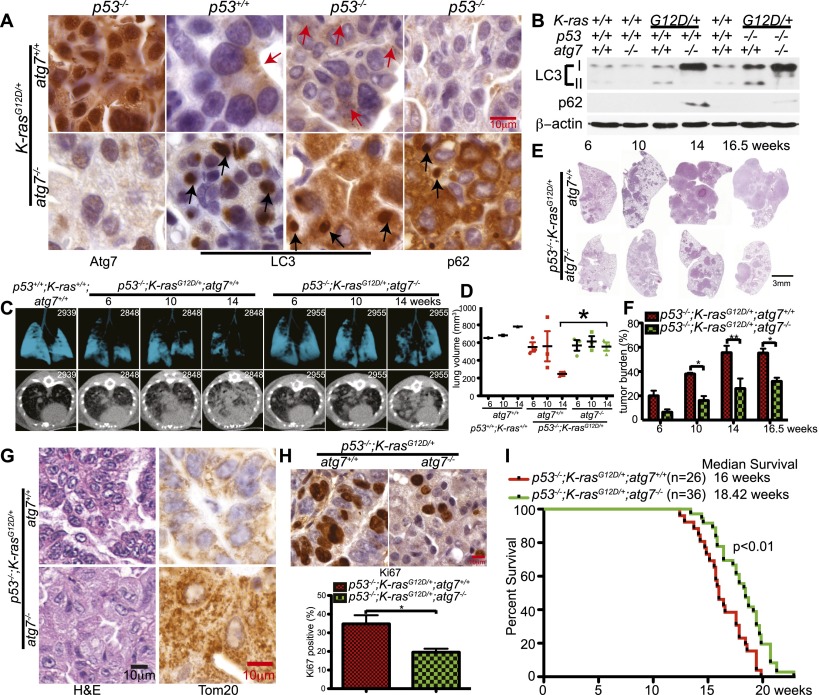
Figure 4.
atg7 deficiency suppresses p53−/−-K-rasG12D-driven NSCLC. (A) Representative IHC for Atg7, LC3, and p62 in tumors at 14 wk after tumor initiation. Red arrows are autophagosomes, and black arrows are LC3 or p62 aggregates. (B) Western blot of LC3-I-to-LC3-II processing and p62 accumulation in tumors at 14 wk after tumor initiation. (C) Representative lung images from tumor-bearing mice (n = 3 mice for each time point and genotype) by micro-CT scanning. A wild-type (p53+/+;K-ras+/+;atg7+/+) mouse provided a normal lung reference. The top panels show three-dimensional reconstruction of mouse lungs, with blue indicating airspace. The bottom panels show transverse section of the chest, with increased white areas indicating tumor. (D) Quantification of normal lung volume from micro-CT-scanned mice from C. Each spot represents an individual mouse. The error bar represents the SEM; (*) P < 0.05 (t-test). (E) Representative histology (H&E) of lungs and tumor burden at the indicated times (n = 3 mice for each time and genotype). Full scans of all lobes are shown in Supplemental Figure S10. (F) Quantification of tumor burden from E. The error bar represents the SEM; (*) P < 0.05; (**) P < 0.01 (two-way ANOVA with Bonferroni post-test). (G) Histology of lung tumors shows a representative adenocarcinoma in p53−/−;K-rasG12D/+;atg7+/+ tumors and oncocytoma in p53−/−;K-rasG12D/+;atg7−/− tumors. IHC of Tom20 shows mitochondrial accumulation in atg7-deficient tumors compared with wild type at 16.5 wk after tumor initiation (n = 3 mice for each genotype). The complete time course is shown in Supplemental Figure S11. (H) Representative IHC for Ki67 in tumors at 18 wk after tumor induction, with quantification below. (I) Kaplan-Meier survival curve of mice with p53−/−;K-rasG12D/+ tumors that were atg7+/+ or atg7−/− (P < 0.01, log-rank [Mantel-Cox] test).

