
Figure 6.
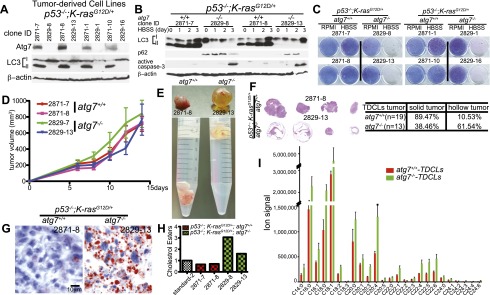
atg7-deficient TDCLs accumulate lipids and are sensitized to starvation-induced death. (A) Western blot for Atg7 and LC3 in TDCLs. (B) Western blot for LC3, p62, and active caspase-3 during starvation (HBSS) of TDCLs at the indicated times. (C) Clonogenic survival assay of TDCLs following 3 d of starvation (HBSS) and 4 d of recovery in normal medium (RPMI). (D) Growth of TDCL tumors in nude mice (n = 6 tumors for each TDCL). (E) Representative gross pathology of tumors derived from TDCLs from D. (F, left) Histology (H&E) of representative tumors from atg7 wild-type and atg7-deficient TDCL tumors showing hollow centers with atg7 deletion. (Right) Quantification of hollow tumor formation. (G) Oil red O staining of TDCL tumors (n = 4 tumors for each genotype). (H) Quantitation of cholesterol esters by thin-layer chromatography (TLC) (Supplemental Fig. S16A). (I) The graph shows the increased total pool size of FAs in atg7-deficient TDCLs compared with wild-type TDCLs under steady status. The error bar represents ±SD; P < 0.05 (t-test).