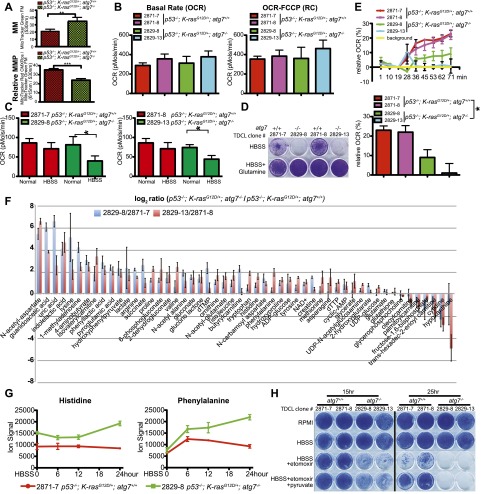
Figure 7.
Autophagy is required for FAO. (A) Total MM (top) and MMP (bottom) in TDCLs under normal conditions (atg7+/+: n = 10; atg7−/−: n = 9 independent clones). (**) P < 0.01; (***) P < 0.001 (t-test). (B) OCR of TDCLs (two independent clones for each genotype) under normal conditions without (left) or with (right) FCCP challenge. The error bar represents ±SD; P > 0.05 (t-test). (C) OCR of TDCLs (two independent clones from each genotype) under normal or starvation (HBSS for 4 h) following addition of FCCP (0.3 μM) to establish maximum respiratory capacity. The error bar represents ±SD; (*) P < 0.05 (t-test). (D) Clonogenic survival assay of TDCLs with glutamine addition (1 mM) under 3 d of starvation (HBSS) and 3 d of recovery in normal medium (RPMI). (E, top) OCR trace of TDCLs in response to palmitate (400 μM) showing relative percentage change upon palmitate addition. (Bottom) OCR of TDCLs from the top panel at 71 min. The error bar represents ±SD; (*) P < 0.05 (t-test). (F) The graph shows autophagy-dependent changes in intracellular metabolite levels (52 metabolites; log2-transformed ratios of ion signals) in two atg7-deficient compared with two atg7 wild-type TDCLs in normal conditions. (G) The graphs show representative increased amino acid levels in two atg7-deficient compared with two atg7 wild-type TDCLs at each indicated starvation (HBSS) time. Additional amino acids are shown in Supplemental Figure S19. (H) Clonogenic survival assay for TDCLs following starvation (HBSS for 15 h and 25 h) in the presence of the CPT1 inhibitor etomoxir (50 μm) with and without pyruvate (1 mM). The complete assay is shown in Supplemental Figure S20.

