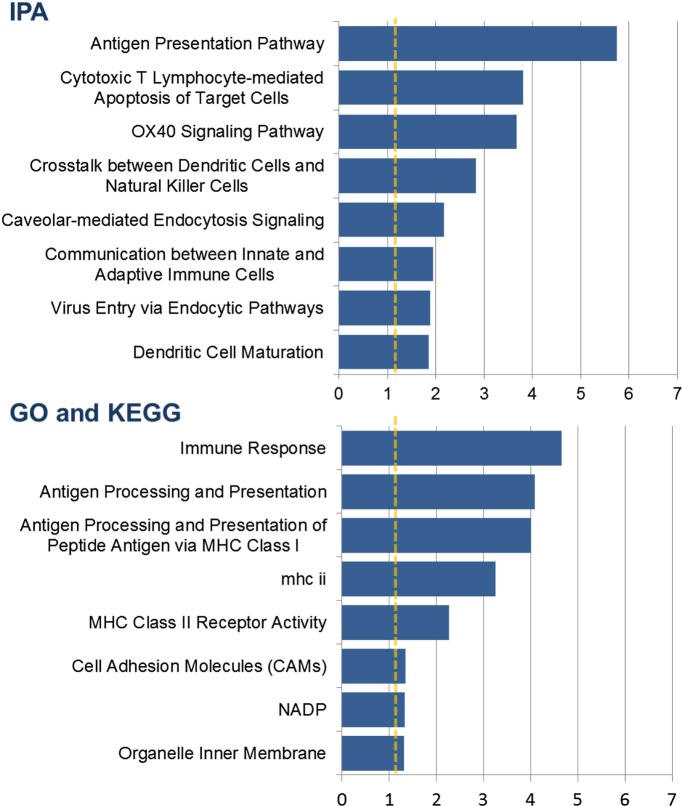
Figure 3. Content analysis shows enrichment for genes involved in membrane trafficking, antigen processing, and antigen presentation.
Barplots show categories with significant overrepresentation in the list of 98 genes with a strong cis-eQTL and a response to vaccination expressed as either a transcriptional response or a change in the genetic effect in both cohorts. The negative log(p-value) is plotted on the x-axis.

