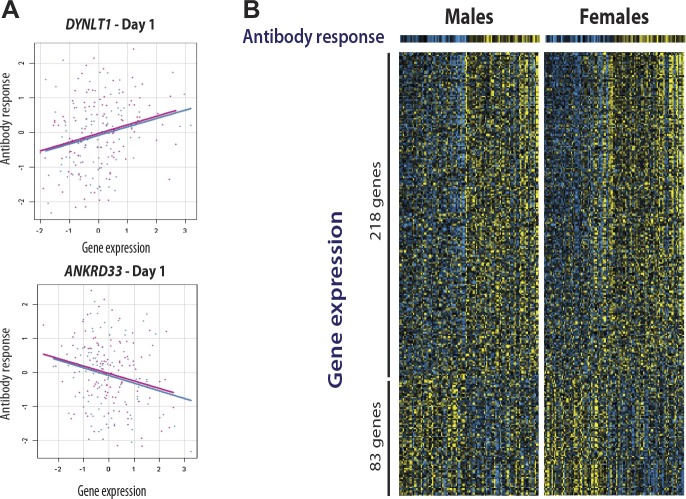
Figure 4. Gene expression at specific loci correlates with the antibody response to vaccination.
(A) Examples of positive (DYNLT1) and negative (ANKRD33) correlation between gene expression on day 1 and the magnitude of the antibody response to the vaccine. Data points and regression lines in the scatterplots display the results for the discovery (blue) and validation (magenta) cohorts. (B) A total of 301 genes showed evidence of significant correlation between gene expression and the antibody response to the vaccine in both cohorts. Of these, 281 showed evidence of positive correlation and 83 of negative correlation. Each individual is represented by a column in the heatmaps. The top heatmaps display the magnitude of the antibody response (titer response index). The bottom heatmaps display the deviations around the expression mean for each gene. Individual gene identifiers and correlation coefficients are presented in the Interactive Results Tool.

