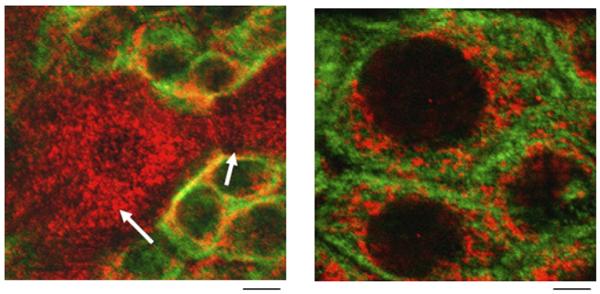
Fig.1.

TRPV1 is detected in urothelial cells of the rat urinary bladder. Left panel, confocal image of urinary bladder urothelium reveals TRPV1 (cy3, red) and cytokeratin (FITC, green) expression. Arrow indicates apical cells within the field from a single plane of focus. Right panel, enlarged image of basal cells depicting TRPV1 (cy3, red) and cytokeratin (FITC, green) in urothelium. Scale bar: left, 15 μm; right, 5 μm.
