
Figure 4. Ndfip1−/− mice have elevated levels of IL-6 that promotes TH17 differentiation.
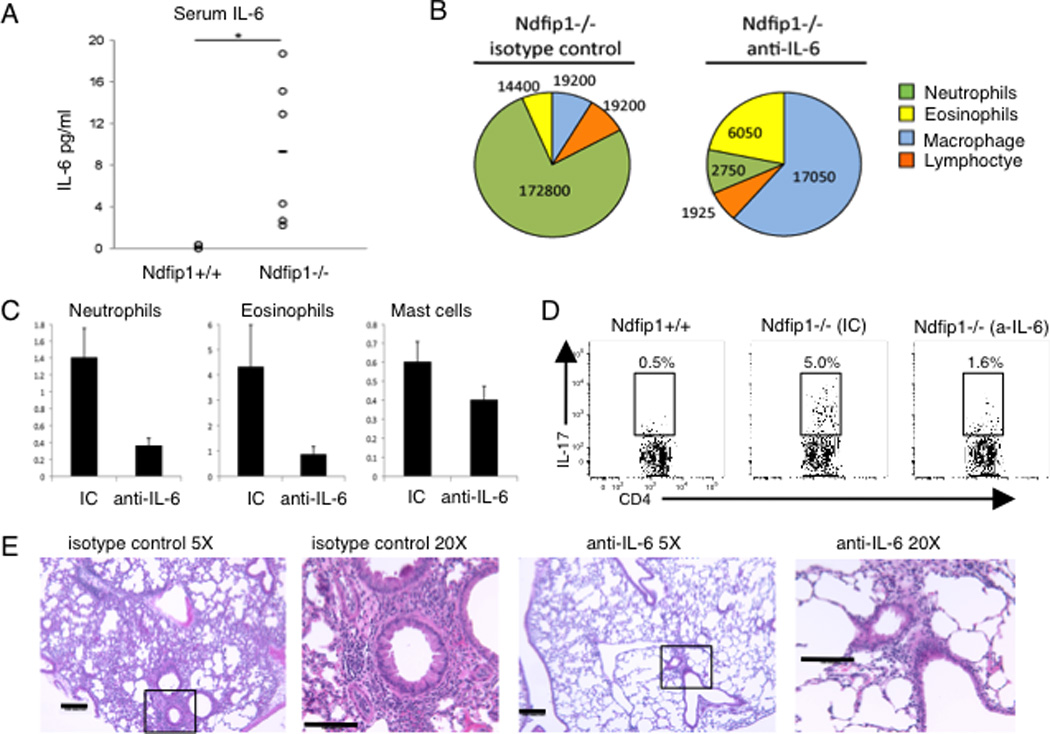
(A) IL-6 levels in the serum from Ndfip1−/− or Ndfip1+/+ littermate controls measured by ELISA. Each circle represents a different mouse and there are 6 mice of each phenotype included. *p<0.05. (B–D) Ndfip1−/− mice were treated with anti-IL6 or isotype control (IC) on weeks 4 and 5 and analyzed on week six of life. (B) BAL fluid from Ndfip1−/− mice treated either with anti-IL-6 or IC was collected and the number of the indicated cells was determined by cytospin. A representative pie chart is shown for each treatment group, n=2 (IC) and n=3 (anti-IL-6). (C) The number of neutrophils (Ly6G+ CD11b+), eosinophils (SiglecF+, Ly6G−) and Mast cells (FcεRIα+ SiglecF−) in the lung tissue homogenate was determined by flow cytometry. The homogenate was from half of the lung tissue. Graphs show the mean + s. d. (D) The percentage of lung cells from tissue homogenates that were CD4+ and IL-17+ were analyzed by flow cytometry. The plots shown are representative of 2–3 mice of the indicated genotypes and treatments. (E) Lungs from Ndfip1−/− mice treated with isotype control (IC) or anti-IL-6 were perfused, inflated with fixative and sectioned. H and E stained sections were analyzed at 5X and 20X. Bar shows 100 microns.