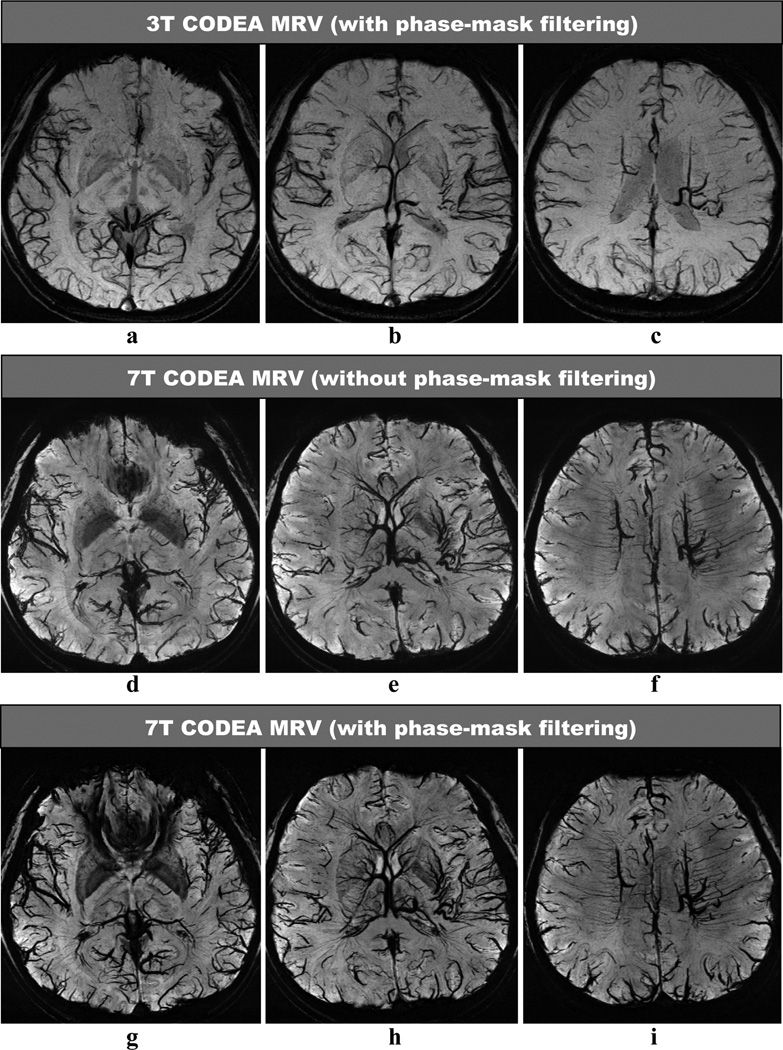
Fig. 3. Comparison of CODEA MRVs acquired at 3T and 7T.
The MRV images are represented at minimum intensity projections over 10-mm thickness. The overall venous contrast and the small vessel detectability of the 7T images (d–i) are higher than those for the 3T images (a–c). Note that the 7T MRV showed improved venous contrast even without phase-mask filtering (d–f), compared to the 3T MRV.

