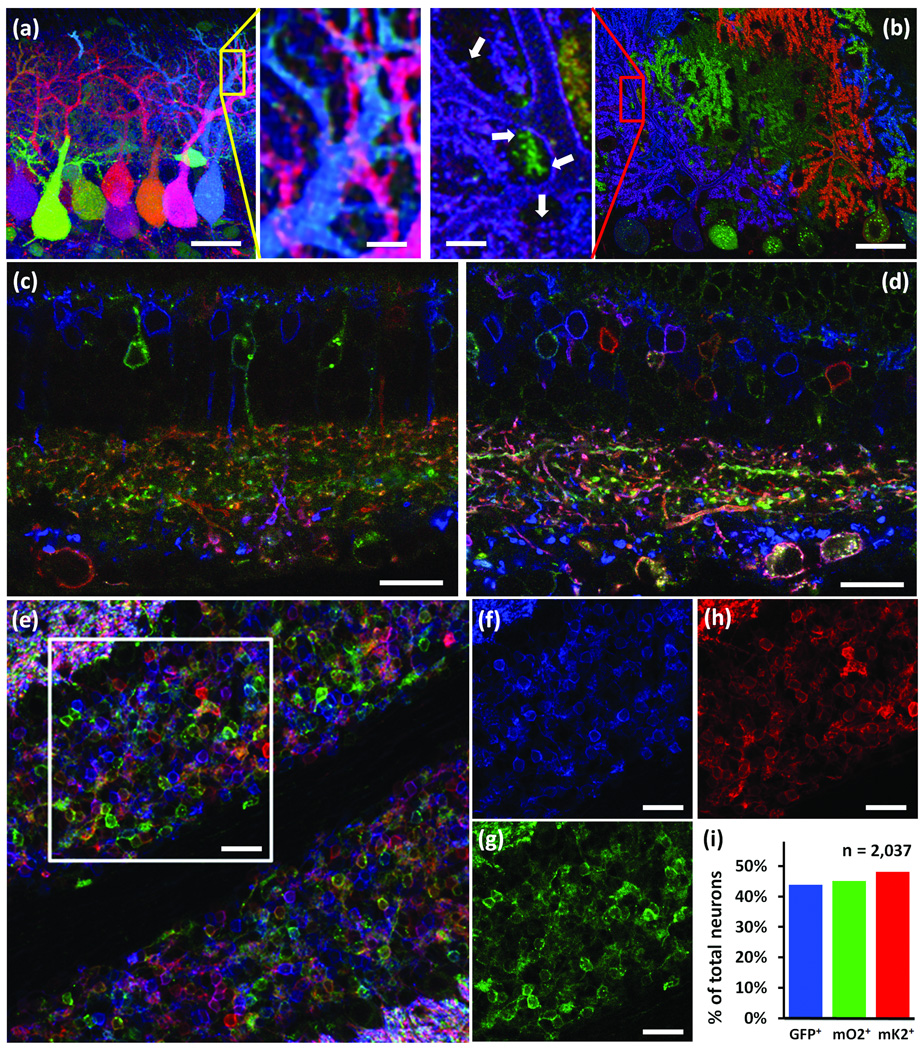
Figure 2. Improved visualization of neurons in Brainbow 3 mice.
(a,b) Cerebellum fromf Brainbow 1.0 (a) and Brainbow 3.1 (line3); L7Cre (b) mice. Left and right panels in the middle show high magnification views of boxed regions in a and b, respectively. The farnesylated XFPs clearly label the fine processes and dendritic spines (arrows, middle right), which are missing in the cytoplasmic labeling (middle left).
(c,d) Retina from a Brainbow 3.0 (line D); Islet-cre mouse expressing EGFP (blue), mOrange2 (green) and mKate2 (red). c shows Intrinsic XFP fluorescence and d shows a nearby section immunostained with chicken-anti-GFP, rabbit-anti-mOrange2 and guinea pig-anti-mKate2. Immunostaining enhances fluorescence and the number of labeled neurons and processes without compromising color diversity.
(e–i) Immunostained cerebellum section from Brainbow 3.2 (line 7);PV-cre mouse. Separate channels of region boxed in e are shown in f–h. The fraction of all labeled neurons that express EGFP (f), mOrange2 (g) or mKate2 (h) is indicated in I (2037 neurons from 15 regions).
Bars are 40µm in a and b, 20µm in c and d, 25µm in e–g, 10µm in inserts.

