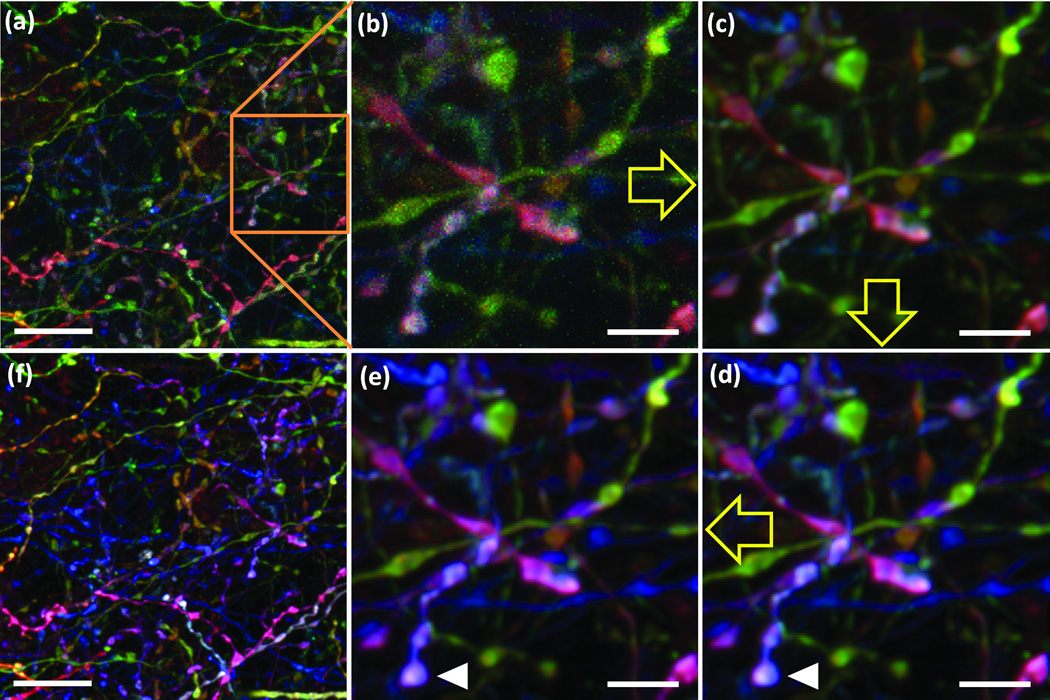
Figure 6. Processing a Brainbow image.
(a) Original image. (b) Region boxed in a. (c) Deconvolution, resulting in decreased noise without sacrificing spatial resolution. (d) Intensity normalization, expanding perceptible color range. (e) Color shift correction (see also Supplemenatry Fig. 10). (f) Fully processed image.
Yellow arrows indicate sequence of the image processing. White arrowheads indicate corresponding objects in the original and color-shift corrected images. Bars are 10µm in a and f, 3µm in b–e.

