

i. Summary
A major component of a hydrogen exchange mass spectrometry experiment is the analysis of protein and peptide mass spectra to yield information about deuterium incorporation. The processing of data that are produced includes the identification of each peptic peptide to create a master table/array of peptide sequence, retention time and retention time range, mass range and undeuterated mass. The amount of deuterium incorporated into each of the peptides in this array must then be determined. Various software platforms have been developed in order to perform this specific type of data analysis. We describe the fundamental parameters to be considered at each step along the way and how data processing, either by an individual or by software, must approach the analysis.
Keywords: Deuterium, software, algorithm, protein dynamics, isotope
1. Introduction
Hydrogen exchange mass spectrometry (HX-MS) is a biophysical technique with roots in analytical chemistry (1, 2). HX-MS utilizes the naturally occurring exchange of the backbone amide hydrogens for hydrogens in the solvent water (3–7). In an HX-MS experiment, a protein is exposed to “heavy water” (D2O) for seconds to hours or days and within that time the protein incorporates deuterium as a function of the protein’s physicochemical properties (8, 9). HX-MS is a medium resolution structural technique, although the exchangeable hydrogen positions that are measured (the backbone amide hydrogens) are found at each amino acid throughout the primary structure, except for proline which has no backbone amide hydrogen (5, 10). Some of the most valuable pieces of information extracted from an HX-MS experiment can come from observing a protein in two or more different conformational states (11, 12). For example, if a wild-type and mutant form of a protein are compared and a difference in deuterium uptake behavior is observed, one can conclude that there must be some change in structure or change in backbone dynamics as a result of the mutation.
With the rapid expansion and utilization of hydrogen exchange mass spectrometry as a tool to study protein conformation and dynamics, there is an increased demand for both robust data acquisition and data analysis tools. Unification of data analysis tools and processing methodology will increase the general reliability of HX-MS on the whole and allow for more direct and valid comparisons of HX-MS data across laboratories that are investigating the same or similar proteins or protein systems.
A comprehensive list of current HX-MS data analysis tools, with brief descriptions, has recently been published (13). The present chapter does not serve as a manual for any of the listed software, nor does it favor one over the other; rather, the presentation here of the analysis of HX-MS data stands as a foundation for understanding which parameters are considered during data processing and how most software approach the analysis. All software algorithms need to be sensitive to restrictive parameters, including: monoisotopic and average mass, m/z range, charge state (s) of the peptide ions of interest, retention time and retention time windows, peptide isotope distributions for peptide isotope intensity above the background noise (for both the undeuterated and deuterated peptides) and peptide ion isotope overlap.
The most complex software is designed to extract raw m/z data from a typical LC-MS run, analyze the HX-MS data by determining deuterium incorporation information either through a center of mass approach or through theoretical modeling of predictive isotope patterns (via statistical analyses), and finally output both two- and three-dimensional results for visualization. There are a myriad of non-commercial software solutions as well as several commercial platforms for the analysis of HX-MS data. The software include those with basic input – e.g., HXExpress – which require only raw m/z versus intensity data to be pasted into an excel macro in order to produce deuterium incorporation and peak width plots (14), to both web-based [HDX Finder (15)] and stand-alone tools [Hydra/MassSpecStudio(16), HeXicon (17, 18), and AUTOHD (19)] that search raw LC-MS data before completing the data analysis. These software tools can all be used in combination with a web-based software suite called MSTools (20) in order to complete data visualization in both two and three dimensions. Other freely available software – HD Desktop (21, 22), HDX finder (15), and HDX Analyzer (23) – start with the raw LC-MS hydrogen exchange data and finish with complete data visualization. There are now two commercial software solutions: HDExaminer (24) and DynamX (25). HDExaminer works with various vendor-specific mass spectrometer output data formats while DynamX is a Waters-specific product which relies on the commercialized version of the nanoACQUITY designed for HX-MS experiments (26).
Despite the growing number of software solutions that have become available over the past decade, there is no single fully automated solution for the analysis of HX-MS data. Each involves some degree of user input for complete analysis. For example, all software packages require some means of supplying peptide identity (i.e., m/z, m/z range, z, retention time range, etc.) when performing pepsin-digestions HX experiments. We believe that user interaction with the data, in some fashion, is desirable both from the standpoint of forcing the user to actually look at the MS data and from the perspective of quality control. Because a good understanding of the HX-MS data processing workflow is required to generate experimental data that will yield robust processing results, we will next present the workflow for the manual analysis of continuous labeling HX-MS data, with a focus on processing local/peptide level data.
2. Materials
The materials needed to process HX-MS data include typical desktop/laptop PCs, data storage capabilities, and of course, the actual HX-MS data. These data may often come from the simplest exchange experiment known as continuous labeling [for a recent review please see (6)]. It is important to have an understanding of the origin of these data, so we have chosen to briefly describe a typical experiment starting from a protein at equilibrium and under its native buffer conditions. Acquisition of the HX-MS data is composed of three logical steps: isotopic labeling of exchangeable hydrogens and reaction quenching; enzymatic digestion of the quenched samples (for localizing deuterium incorporation); reversed-phase peptide separation and mass spectrometric measurement of the mass of each peptide ion.
Isotopic labeling of the exchangeable hydrogens is the first step in the experiment. Labeling is initiated either via a dilution or fast buffer switching into a buffer prepared with greater than 98% D2O (27). This large excess of deuterium drives the forward labeling reaction. The reaction is allowed to proceed for specific amounts of time (from milli-seconds to days), and is then quenched through a reduction of the solution pH to 2.5 and temperature of 0 °C (10). These specific quench conditions are achieved either using a strong buffer system (10x the strength of the labeling and equilibration buffers) or a small volume of a concentrated acid. Quenching conditions can also include chaotropic agents (guanidinium chloride, urea) and/or reducing agents (TCEP) in an attempt to facilitate a more productive proteolytic digestion, see below (28–30).
The next step in the experiment is the enzymatic digestion of the protein in quench buffer. Remembering that specific conditions (low pH and temperature) need to be maintained in order to preserve the deuterium labeling, the digestion also needs to be performed under these quench conditions. Additionally, the digestion step needs to be performed as fast as possible in order to maintain as much of the deuterium label as possible. There are two widely used proteolytic enzymes that meet these criteria: pepsin (10), and aspergillopepsin (protease type XIII from Aspergillus saitoi) (31). The digestion step can be performed in one of two ways: in solution using either free or immobilized pepsin or performed online using a digestion column that is packed with pepsin that has been immobilized onto a bead/particle (29, 32).
Reversed-phase chromatography of the peptides produced during digestion (known hereafter as “local analysis”), or if enzymatic digestion was not performed a simple LC desalting of the intact protein (hereafter referred to as “global analysis”) is the next step in the experiment. The chromatography step also needs to be performed quickly under quench conditions in order to minimize the loss of deuterium label. Peptide separation is either achieved using traditional RP-HPLC (33) or more recently RP-UPLC technologies (26, 34). Separation of the peptides significantly reduces the complexity of the resulting mass spectra, especially for larger proteins and protein complexes.
Figure 1 illustrates the raw HX-MS data that any software tool or human equivalent would encounter after the data are acquired and processing is about to begin. There are data like this for the undeuterated control and typically between 4 and 12 hydrogen-deuterium exchange samples (greater than 12 are required when the desired processing outputs include exchange rates see below: Extracting kinetic information). There are total ion chromatograms (TIC), each with corresponding m/z spectra acquired with scan rates that are user defined and generally dictated by the speed of the chromatographic separation. As an example, consider a single protein, local HX-MS experiment with a 10 minute chromatography cycle time, a mass spectrometry scan rate of 5 scans per second, and a total of 6 LC-MS runs. In this example, there would be 18,000 mass spectra with m/z values ranging from 50 to 2000 m/z. If there are 130 unique peptide ions to follow in the data analysis, this number of samples and peptides would result in 2.36x10⁶ total ions that will have to be queried in the mass-to-charge range (50–2000 m/z). A human sitting at a computer and manually processing these data may encounter fewer spectra to investigate as they might sums scans together and immediately reject the analysis of peaks that are obvious artifacts, noise or adduct peaks. However, an algorithm would have to deal with all the data to sort out what is good and what is not. Criteria for rejecting spectra are a definitive aspect of an algorithm’s behavior and can include evaluation for an unexpected isotope distribution, evidence of overlap with another isotope distribution, evaluation of signal to noise ratios, among other properties. Additionally, as the protein system that is being investigated becomes increasingly more complex (large) and perhaps includes multiple proteins binding on to one another, the number of peptide ions that have to be dealt with becomes more than a single human user can handle within a reasonable amount of time. The massiveness of the data that possibly could be collected has been prohibitive in recent years, limiting the size of a protein/protein system a person was comfortable processing in a reasonable amount of time. Streamlining the processing, increasing the efficiency of data interrogation and automation of many of the steps has been key to the development of HX-MS data analysis tools.
Figure 1.

Visual inspection of HX LC-MS data. (A) Base peak intensity chromatogram (PBI) for the online digestion of a model 97 kDa protein separated using UPLC with a water:acetonitrile gradient in 10 minutes. (B) Summed data for the m/z range of 150 and 1050 m/z for the highlighted portion of the BPI in panel A. The starred inset is taken from a zoom in on the 491–496 m/z range and displays a single natural isotopic distribution for a (4+) ion in this modeled undeuterated control sample. Dashed rectangles indicate the amount of data that are produced in a typical HX-MS experiment.
3. Methods
The scope of data analysis in HX-MS experiments is illustrated in Figure 2. This flow chart illustrates the basic workflow of data analysis for both global (or intact protein level, Figure 2A) and local ( or peptide level, Figure 2B) analysis. Global analysis and local analysis are different in complexity, yet maintain a similarity in the core processes of displaying data, deuterium pattern analysis, and the calculation of average deuterium incorporation (Figure 2 dashed boxes). Despite being the easier HX-MS experiment to perform, the information that can be gleaned from global analysis is limited. Global analysis measurements can report on the solution-phase dynamics of the protein backbone solely at the whole protein level. As the exact protein sequence is known, the theoretical amount of deuterium incorporation can be compared to the measured deuterium incorporation level to reveal overall characteristics of the protein (2). Specifically, the number of residues in a protein which are part of stable structures can be inferred from the difference between the theoretical maximum deuterium incorporation for the protein and the maximum observed incorporation at the longest labeling time points (from hours to days). Similarly a measurement of the residues which are likely in unstructured or very dynamic parts of the protein can be estimated by measuring the uptake at very short exposure times (10 seconds or less) (35, 36). The shape of the uptake curve can also yield information on the timescales of various conformational dynamics in the protein. With the limited amount of biophysical information that can be obtained from global analysis, the frequency of global analysis experiments is low. For this reason, we will devote the remainder of the chapter to local analysis, and note that many of the principles presented for local analysis also apply to global analysis.
Figure 2.
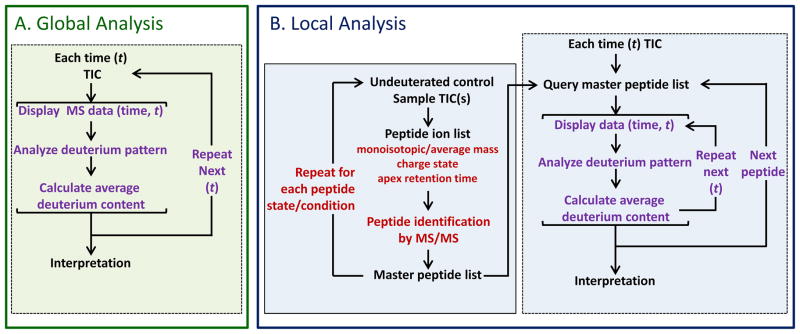
Typical data analysis workflows for both (A) global or intact protein and (B) local or peptide level hydrogen deuterium exchange data analysis. The repetitive nature of the analysis is emphasized at each step. Dashed lined boxes indicate the common steps between the two workflows.
The significant preference for local analysis over global analysis is due to the amount of biophysical information that can be obtained. Local analysis can resolve deuterium incorporation information to specific locations within a protein (10, 37, 38). Deuterium incorporation can be localized to peptides that range in size from 5–20 amino acids. Measurement of peptides with overlapping sequences can often be used to further resolve uptake to individual backbone amide hydrogens along the primary structure of the analyte protein.
For all of the above reasons, in the following paragraphs we will present the fundamentals of how one would manually process the data, what key parameters are considered at each step in the process, and describe what special considerations that need to be addressed by an algorithm trying to mimic in an automated fashion what a person would do when presented with data.
3.2 Displaying HX-MS data
The first step in the analysis is the visualization of the raw LC-MS data (total ion chromatograms and the corresponding/linked mass spectra). This inspection serves as the initial quality control to validate that it makes sense to proceed and to complete data analysis. For example, if the separation is of poor quality or the signal-to-noise ratio is poor, it may not make sense to move on to the subsequent steps. A typical progression of HX-MS data inspection is illustrated in Figure 1 where a model reversed-phase UPLC chromatogram at 0 °C (Figure 1A) and the complicated m/z spectrum that can be observed from a single peak of the chromatogram (shaded region of Figure 1A and 1B) for an online pepsin digestion (in this case of a 100 kDa protein) are shown. Focusing in on the shaded region of the chromatogram, it is obvious that there is a significant amount of peptide signal in the mass spectrometer from any one chromatographic peak. Each one of the ions corresponds to a peptide from the pepsin digestion. Despite the full m/z spectrum being complicated and crowded, zooming into smaller m/z ranges will often show well resolved peptides with no interfering ions nearby. For example, the inset in Figure 2B shows a range of 491 to 496 m/z containing a single +4 peptide ion. The inspection of the data continues in this manner across the LC and m/z scales until it is clear that there are no issues with the peptide data such as low ion intensity, poor chromatographic resolution of ions, and lack of deuterium label (see below), etc. The higher the fidelity of the reversed-phase separation of peptides, the easier it is to pinpoint and identify which deuterium labeled peptides goes with which unlabeled version of the peptide.
It is at this point in the inspection of the data that the evidence for the successful labeling of the protein backbone with deuterium is determined. This inspection of the deuterated protein samples is done to be certain deuterium was actually incorporated, the isotope distributions are as expected (see below) and that the signal-to-noise is acceptable for processing. Consider the example shown in Figure 3 for a +4 ion (also shown in Figure 2B) of a peptic peptide. The natural isotopic abundance for the undeuterated version of this peptide appears as a Cauchy Distribution, as shown in panel A of Figure 3. Theoretically, after 5 hours of hydrogen exchange in D2O, with the assumption of uniform labeling and no back exchange of the deuterium label to hydrogen, the resultant isotope distribution would look as shown in Figure 3B. As the incorporated deuterium (2.014101 amu) weighs more than hydrogen (1.007825 amu), for each deuterium atom incorporated into the peptide, the natural abundance isotope distribution will shift to a higher mass dictated by the mass difference between 2H and 1H isotopes, equal to 1.006 Da/z. However, deuterated peptides undergo back exchange in the fully protonated RP-UPLC step [for a complete discussion of back-exchange please refer to: (10, 39–42)] and this deuterium loss is random. As a result, the isotopic distribution of a deuterated peptide in HX-MS is not the “normal” isotope distribution one expects, but rather it is a more symmetrical Gaussian distribution (Figure 3C). As a protein spends more time exposed to deuterium, this isotope distribution moves to higher m/z values but maintains this Gaussian distribution through its increase in m/z. Movement will continue until the peptide reaches a maximum possible incorporation that is dictated both by experimental conditions (i.e., pH, temperature, labeling time, and percent excess of deuterium in the sample) and protein conformation. See note 4 for the calculation of maximum possible deuterium incorporation.
Figure 3.

Isotopic distributions of peptides in HX-MS experiments. The natural abundance isotope distribution for peptides in the undeuterated control is shown in (A). The isotopic distributions of the same peptide after 5 hours of exposure to deuterium are shown for the case of no back-exchange (B) and the actual distribution for the peptide after experiencing back-exchange (C).
Another important consideration during data inspection is the peak shape. It will be readily apparent if there is evidence that exchange has occurred through either or both of the two kinetic limits of HX [for a complete discussion of these two limits, please see (5, 8, 9, 43, 44)]. Briefly, most proteins follow the EX2 regime for backbone hydrogen exchange. In EX2, proteins make many visits to the exchange competent state before deuteration occurs. The result is a single binomial distribution in the mass spectrum that slowly increases in m/z, as described above. The much more rare type of kinetics is EX1. In EX1, a region(s) of the protein backbone visits the exchange competent state and exchanges all backbone amide positions in a coordinated fashion. Importantly, EX1 and EX2 kinetics are visually differently in mass spectra (45). For simplification, we will only discuss EX2 data in the following sections (see note 2 for a discussion of obvious as well as less-obvious EX1 data as well as how to best plot these deuterium incorporation data).
3.3 Peptide Identification
One main feature of an HX-MS experiment on the local level is the creation of peptic peptides. The identity of each peptide (i.e., the amino acids contained within) must be determined. The mass spectrometer, however, just measures mass. There must be a correlation step in which specific peptide ions – each with a measured monoisotopic mass, charge state, and chromatographic retention time – are attributed to amino acids of the protein. For example, an ion with a monoisotopic mass of 563.98, a charge state of 3+ and chromatographic retention time of 2.79 minutes is eventually assigned to amino acids 11–23 of the protein being studied. The proper identification of peptides creates a master peptide list of peptides for which valid data interpretation can be obtained after the deuterium incorporation of each ion has been measured.
The correct identification of peptic peptides is important if the final interpretation of the HX-MS data is to be considered reliable. Peptic peptides are identified using the undeuterated control sample that was prepared alongside the deuterated samples. Despite maintaining a preference for cleavages between hydrophobic residues, pepsin is a non-specific acid protease and the cleavage pattern, although reproducible, is not predictable (46). The seemingly simplest, and considered by some wholly sufficient, way to identify a peptic peptide is use the exact mass of each peptide in a search of the protein sequence for all possible amino acid combinations that could produce the observed mass. For a single protein HX-MS experiment, searching the known protein sequence may yield only one or two theoretical possibilities solely based on exact mass alone. From this, if you are lucky, one of the other hits for the exact mass will be beyond an error tolerance of the measurement. In more instances than not, this is not the case. Figure 4 gives an example where a hypothetical search using the observed monoisotopic mass of 714.0676 (3+) was performed against the entire amino acid sequence of a small 8 kDa protein using an initial mass tolerance of 1.0 Da. The results of this search yield three possible peptide matches or hits for this ion. Two of these hits have very small deviations (−0.06 Da and −0.07 Da) from the measured monoisotopic mass of the peptide and one has a significant deviation (0.81 Da). The potential hit with the highest deviation from the true mass is discarded as the accuracy of mass determination in a well calibrated modern mass spectrometer is much better than this error (0.81 Da). The two remaining possibilities, with much smaller deviations, are within the error of the mass measurement. In order to determine which of the two remaining possibilities goes with the mass 714.0676, tandem MS (MS/MS) experiments are performed. It must be noted that for a small protein the number of potential hits is small. As the size of the protein and complexity of the protein system increases the task of peptide identification becomes more difficult and relies more heavily on MS/MS analysis. We advocate the identification of all peptic peptides using MS/MS, and the application of strict criteria before assignment is made. There are few things worse than making an interpretation of deuterium incorporation data to later find there was a peptide that had been misassigned.
Figure 4.
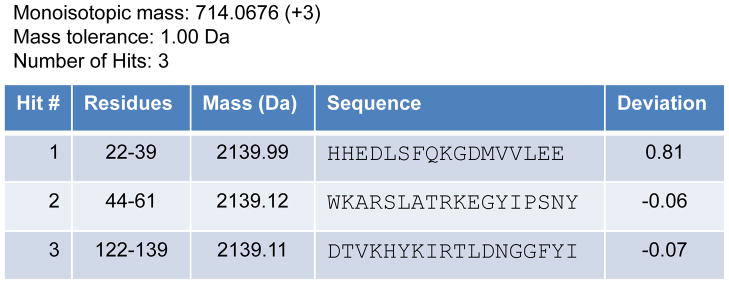
Identification of potential peptic peptides from exact mass matching. A search of the amino acid sequence of an 8 kDa protein for a peptic peptide that matches a monoisotopic mass of 714.0676 for the 4+ charge state with a 1.0 Da tolerance yields a total of three possible peptides.
Identification of peptides by MS/MS can be performed using two different MS/MS methods, data dependent acquisition (DDA) or data independent acquisition [DIA or MSE as it is commercially known (47)]. Note that the identification of peptic peptides is a separate experiment from that of the determination of deuterium content for HX samples (Figure 2B workflow in the solid box). There is no way to avoid this. Using DDA, the first LC-MS run of the undeuterated control sample is used to survey both the quality of the digestion and the ions that are produced from the pepsin digestion. Additional undeuterated controls are then needed to perform the MS/MS analyses, either including ions to be interrogated by MS/MS or creating exclusion lists of ions not to look for in subsequent runs. Using DIA, all survey and MS/MS data are acquired simultaneously. Regardless of which method is used to identify the peptic peptides, it is only necessary that the fragment ions that are produced allow for an accurate identification of the peptide between the hypothetical choices.
The final result in peptide identification step is the creation of a master peptide list that is used within the software as a map of where to look within the deuterium exchange samples to locate the peptides for which positive identification is known (i.e., the correlation between ion and amino acid sequence has been made). This list will include peptide sequence information including the number of amino acids, the beginning and ending sequence number, the number of proline residues, the monoisotopic and average masses of each ion, the charge state(s), an m/z window within which to look for deuterated peptides (determined by knowing the maximum amount of deuterium that can be incorporated, which is known once the number of amino acids is known), the retention time (at the apex of each chromatographic peak) and the retention time window.
3.4 Determining deuterium incorporation
Deuterium incorporation is measured relative to an unlabeled sample acquired along with the labeled samples. In the case of EX2 kinetics, measuring the deuterium uptake is a simple matter of tracking the mass of the peptide as a function of increasing exposure time. For the individual processing of HX-MS data by hand, there is a deep reliance on visual cues (e.g., consistent charge state, alignment of the isotopes on the m/z scale between undeuterated and labeled samples, the increase in mass of the isotope distribution, etc.) when determining the amount of deuterium in any one peptide. A data processing algorithm needs more guidance and limitations.
Before an algorithm can determine the amount of deuterium that has been incorporated into a peptide, it is necessary to define the maximum mass increase possible and therefore the window of m/z within which a partially deuterated ion may be found (the window stretches from the undeuterated peptide m/z to the maximally deuterated peptide m/z). We will call this the deuteration window. If there is good chromatographic alignment (i.e., reproducible elution time) of peptides between undeuterated and deuterated samples, it becomes much easier to be confident that a peptide appearing in a deuteration window is in fact the peptide that has become deuterated rather than another species/peptide that simply has an m/z that happens to fall within the defined deuteration window. A person can quickly look and find the deuterated ions of interest often without even knowing the upper boundary of the deuteration window. Software, on the other hand, needs to be given an upper limit to the deuteration window so it can perform peak detection only within the deuteration window. The peak detection to find the deuterated isotope distribution within the window must then be done in light of a few other variables. Consider the isotope patterns in Figure 3A and C. The natural isotopic abundance of a peptide is dominated largely by peaks spaced according to the varying number of 13C isotopes in the population. The m/z spacing of the peaks is approximately a function of the mass difference between the 13C and 12C isotopes, equal to 1.003 Da/z. For each deuterium atom incorporated into the peptide, the natural abundance isotope distribution will shift to a higher mass dictated by the difference between 2H and 1H isotopes, equal to 1.006 Da/z. This can be visualized in Figure 3B, where the isotope distribution remains the same as that found in the undeuterated peptide, only shifted to higher mass as the result of exchanging several hydrogens for deuterium atoms. Software must be able to recognize when a deuterium isotopic distribution begins and when it ends, in order to proceed to the next step. Peak detection, including isotope peak detection within the cluster, must consider both intensity and spacing as just defined.
In practice, the observed deuterated peptide spectrum becomes more complex as different numbers of both 13C and 2H isotopes define the population of ions contributing to the peptide spectrum. The spectrum is most easily defined as a series of natural abundance distributions offset by multiples of the 2H/1H mass delta, the intensity of each offset being defined by the fraction of ions with the corresponding number of 2H atoms which have been incorporated. It is imperative that any algorithm consider these parameters. The different mass shifts arising from 13C/12C (1.003 Da/z) versus 2H/1H (1.006 Da/z) mass deltas will for the most part be unresolvable on time of flight or ion trap based mass spectrometers, however they must still be accounted for when performing isotopic peak detection with low mass tolerances. For example, consider a deuterated isotope distribution in which the first peak in the distribution will be the monoisotopic peak (containing all isotopes with the lowest mass number, i.e. 1H, 12C, 14N, 16O, 32S) with a well characterized mass of [M] Da/z. The third peak in the distribution, located approximately at [M + 2] Da/z will be observed as a superposition of three ion populations each with, for example, two heavy isotopes:13C22H0 at [M + 2.006] Da/z, 13C12H1 at [M + 2.009] Da/z, and 13C02H2 at [M + 2.012] Da/z. The measured position and width of the peak will therefore lie somewhere in the range from 2.006–2.012. This 6 mDa/z range might seem insignificant at first, but amounts to 6 ppm for a 1000 Da peptide. The uncertainty in expected mass will get larger when considering peptides that can exchange more deuterium atoms and should be considered if searching spectra for accurate masses. Fortunately, the error expansion is bounded: instrument sensitivity will impose a practical limit to the maximum observable 13C isotopes and the primary structure of a peptide dictates the maximum number of 2H atoms which can exchange.
After the low and high ends of the m/z range for an isotopic distribution of a deuterated peptide ion have been determined, the centroid C or first moment of the cluster can be determined for the undeuterated control (UND), and each deuterium labeling time point (t):
| (1) |
where I is the spectral intensity at each m/z value. The summation is carried out over a range encompassing the entire isotopic distribution, which is defined by some intensity threshold on either side of the distribution. For a person doing this determination, one simply uses software [such as MagTran (48)] or the mass spectral processing software of the instrument vendor to find the first moment by drawing the boundaries of the m/z range for centroiding. Software designed for HX-MS analysis makes a similar calculation but instead uses information it has obtained from peak detection as the low and high m/z boundaries. A centroid calculation is indicated in Figure 3A and C with the shaded area underneath the defined curve describing the area that is being considered and with the calculated first moment indicated with the dashed line.
The first moment on an m/z scale can be converted to the mass only scale by removing the charge component:
| (2) |
where we use MC as the mass of the charge carrier (in most experiments this is a proton and equal to 1.007825 Da). The charge state of the ion is represented as z. Using mass only values instead of m/z allows comparison of data regardless of peptide charge state and makes it easier to average or combine data from several charge states of the same peptide (see below).
Figure 3C shows the spectra for a peptide that has been exposed to deuterium for five hours. The relative deuterium level, defined as Dt, is calculated by subtracting the charge state corrected first moment (or the centroid value converted to a mass only scale) for the undeuterated peptide MUND from that of the deuterium labeled peptide Mt.
| (3) |
The relative deuterium level is the fundamental measurement obtained in an HX-MS experiment. When presenting relative deuterium level results, it is desirable to include estimates of errors, usually in the form of standard deviations, or related properties such as variance or confidence intervals. These error estimates can arise when the Dt is determined from multiple charge states of the same peptide or by averaging multiple determinations. For a collection of centroid mass measurements (Mt,i), each measurement can use a weighting factor (wi) corresponding to the total intensity of all isotopes used to calculate each centroid. Lower intensity measurements often have higher errors, weighting the mean calculation can prevent these signals from having disproportionately large effects on proceeding calculations. An aggregate measurement of the centroid mass (M̄t), can then be calculated with a weighted mean:
| (4) |
The corresponding weighted variance is calculated as:
| (5) |
Note an algorithm can just as easily apply equal weighting to each measurement, in which case Equations 4 and 5 reduce to their traditional unweighted forms. When calculating the relative deuterium level in Equation 3, if the deuterated and undeuterated masses have associated variances of and respectively, then the variance of the relative deuterium level becomes:
| (6) |
For the individual processing HX-MS data by hand, it is a task of visually identifying the isotope distributions for the undeuterated control sample as well as for all exchange time points. Then, the centroid values of all these isotope distributions are determined using an excel macro [such as HXExpress (14)], the vendor specific mass spectrometer software, or a standalone program such as MagTran (48). The measured values are then inserted into Equation 3 to determine the relative deuterium level Dt.
Keeping the above in mind, the number of these calculations that must be performed in a typical HX-MS experiment can become very large, and therefore become a major challenge to perform by hand. Each measurement of deuterium incorporation will be a function of three experimental parameters: the peptide itself, physical state of the sample (i.e. wild-type versus mutant, native versus denatured, free in solution versus ligand bound, etc.), as well as the deuterium exposure time. Consider a peptide which exists primarily in two charge states. To obtain reasonable estimates of variability, each HX-MS experiment (from labeling to data analysis) is performed in triplicate. Therefore, three deuterium incorporation determinations are performed for each charge state, or 2 × 3 = 6 total deuterium incorporation determinations. A simple HX-MS experiment might be interested in measuring 50 peptides from pepsin digestion, under two separate equilibrium conditions, at four different deuterium labeling times (not to mention multiple undeuterated control samples). At this point 6 × 50 × 2 × (4 + 1) = 3000 individual deuterium incorporation determinations must then be performed. Software can make these determinations fairly rapidly, all the while taking advantage of the peptide identification information provided by the master peptide list. As more complex protein systems are analyzed, say with perhaps 300 peptic peptides, 4 replicate determinations, 6 exchange points and for a wild-type and 3 mutant versions of the protein, the number of analyses becomes astronomically larger. When examining more complex proteins and protein systems it is common to have experiments involving tens of thousands of deuterium incorporation measurements. The availability of software that can perform automated calculations is very helpful when faced with such a large number of measurements. We also think that once software has made such determinations, it should display the final calculations on top of the raw data for quick visual inspection of the fidelity of the calculations. Whereas a human is much slower at making all the manipulations required to do the actual deuterium incorporation determination, a human can very rapidly provide quality control for thousands of software-determined deuterium incorporation determinations per hour, ascertaining if the software has performed well or not.
3.5 Plotting HX-MS data
The relative deuterium levels that have been determined for the peptides of interest at each labeling time are then plotted against exposure time in deuterium to create a deuterium incorporation plot, or uptake curve. The data are best plotted on a semi-logarithmic plot as it allows for a clear view of the information from the earliest time points (seconds) to the longest exchange points (many hours to days). Figure 5 shows example uptake curves for a protein in two different states, wild-type as well as a mutant version (the mutant could be the result of a single-point amino acid mutation or an alteration to the protein native-state equilibrium as a result of denaturants or a ligand binding event). Panel A of Figure 5 shows model data for this 4+ peptide in the undeuterated control as well as after 5 hours of exposure to deuterium. The dashed lines show the shift in the centroid between the two isotope distributions. The wild-type protein had a much larger upward shift in centroid than the mutant, which is reflected in the uptake curve itself (Figure 5B). For the data in this figure, we are not showing error bars but there is always an error associated (on the Y-axis) with each data point. Typical errors under well controlled experimental conditions such as precise sample preparation, stable mass spectrometer calibration, and short time in between replicate sample set collection, are in the range of ± 0.2 Da (49) [see also Ref. (13) where a thorough review of errors in measurement was recently described]. Looking at the data in both panels of Figure 5, both the raw mass spectra and the uptake graphs themselves after the centroids were measured and deuterium incorporation determined, it is clear that this is a peptide region for the mutant protein that is of interest. There is a consistent retardation in deuterium incorporation in this part of the protein from the earliest time points. The absolute magnitude of this change is not always as important as the identification that this is a region of the protein that is sensitive to the mutation, as evidenced by the change in deuterium uptake.
Figure 5.

From raw m/z data to a deuterium incorporation plot. (A) Mass spectra for a peptide 491.48 m/z (4+) for the undeuterated control as well as a 5 hour deuterium exposure time point. Data are shown for both the peptide that comes from a wild-type protein as well as a mutant form of the same protein. (B) The relative change in mass for the same 491.18 m/z peptide, both in the wild-type (circles) and mutant (squares) states. Deuterium incorporation data are plotted together on the same axes highlighting the differences at each time point.
3.6 Post data analysis: Interpretation and visualization
At the end of determining the deuterium incorporation into each peptide on the master peptide list, the result is a tabulation of deuterium level at each exchange point, along with the corresponding plots. This is, however, not “the end of the road” for these data. Most commonly there are various post analysis steps, including several kinds of data manipulations, calculations of kinetic parameters, additional ways in which to visualize the deuterium incorporation versus time data, and/or biophysical interpretation of the HX-MS data. Performing any or all of these final steps in the HX-MS experiment depends upon the type of information that is desired. We have chosen to discuss three of the most common post data analysis processing steps.
Back exchange correction
All the data processing steps that have been discussed up to this point have determined the relative deuterium level of a protein in deuterium relative to the same protein without deuterium. There has not been any correction for back exchange that occurs during the LC-MS analysis step. The data from many HX-MS experiments can be corrected for back-exchange (to account for the loss of deuterium that occurs post quench), although we have often questioned the usefulness of the correction in many types of experiments [see Ref. (5, 6, 39)]. The correction is based on the first descriptions of HX-MS (10) and has been explained in detail in (10, 42). Briefly, a sample of the protein of interest is maximally deuterated (maximally deuterated control) by unfolding the protein (through a combination of pH, temperature, and/or denaturant) to expose all backbone amide hydrogens to D2O. This sample is then considered to be deuterated at each available backbone amide position (or as dictated by the percent deuterium in the buffer after dilution) until injection into the LC-MS system for analysis. The most common correction (10) for back exchange is performed using the equation:
| (7) |
The deuterium level (D) is calculated at each time point (t) using experimentally determined centroid masses measured for the undeuterated control MUND, the maximally deuterated control M100%, and by knowing the maximum number of deuterium atoms which can be incorporated N. The deuterium incorporation plots in Figure 6 illustrate the application of this correction to produce the absolute deuterium level (corrected data) from the relative deuterium level data (observed data). There is very little added advantage to making this correction, except in cases where the absolute number of deuterium incorporated must be determined. For comparison of experiments between two or more state of the protein, this absolute number of deuterium information is often not required. There are also some caveats to the back-exchange correction. Occasionally, a peptide does not follow the theoretical considerations of Equation 7. This correction only works for 92% of peptides, where the error is less than 10%; for the remaining 8% of peptides, the error of the correction is significantly higher (10). Additionally, a maximally deuterated control must be prepared and this is often not possible due to aggregation, resistance to unfolding for complete deuteration, and several other factors. In fact, one is never really certain that a totally deuterated species has been prepared without analysis – but the analysis itself causes loss of deuterium meaning that the mass of the totally deuterated species can never be truly known. Again, when using an HX-MS experiment to determine if there is a region or regions of the protein that has undergone a change in deuterium incorporation upon mutation or an alteration to the native-state equilibrium, it is not necessary to convert the relative deuterium information to an absolute number of deuterium incorporated. The identified difference will persist regardless of whether or not the data have been corrected for back-exchange. It should be noted that amino acid mutations that involve proline residues have the added effect of either the addition or the removal of exchangeable backbone amide hydrogens. In these cases, care needs to be taken when considering differences for these peptides.
Figure 6.

Correcting HX-MS data for back-exchange and fitting the data to obtain kinetic parameters. The data are plotted as both relative deuterium level (observed data, diamonds) as well as number of deuterium (corrected data, circles) after the data were corrected for back-exchange according to equation 7. Identical model data are shown in both the top and bottom panels. The graph at the top shows 20 exchange time points between 3 seconds and 12.5 hours. The bottom graph is the same as the top but with 11 time points removed.
Extracting kinetic information
Fitting the back exchange corrected HX-MS data in order to extract exchange rates can also be performed. The measured exchange is the sum of the exchange of each backbone amide hydrogen in a peptide, defined by a multi-term exponential equation that sums each of the exponential terms describing each of the backbone amide hydrogens (10). As some backbone amide hydrogens may have similar exchange rates within a peptic peptide, the summation usually reduces to a series of terms describing several populations: slow, medium, and fast exchangers using equation 8 where D is the deuterium level of the peptide with N amide linkages, t is the deuterium exposure time and ki the pseudo-first-order rate constant for exchange at each backbone amide linkage (3, 10).
| (8) |
Multiple examples of determining the rate constants of exchange and how many amide hydrogens are in each category have been described [e.g., (50–52)]. Despite fitting the deuterium incorporation data to the sum of exponentials, no individual amide specific information can be gleaned from this analysis at the peptide level. Importantly, the number of deuterium exchange time points influences the success of these kinds of analysis. Fitting the data to three exponentials will be difficult without being able to establish regions for slow, medium, and fast backbone amides on the corrected data. Figure 6 illustrates this point. The 20 exchange time points that are on the top panel easily show three transitions. Deleting 11 of these data points across the experiment time course yields the deuterium incorporation plot at the bottom. Significantly, with fewer exchange time points, it is more difficult to see the transitions and the resultant fit of these data to equation 8 can be harder to perform correctly.
HX-MS data visualization
The visual representation of the deuterium incorporation information can sometimes be the most difficult part of an HX-MS experiment, as there are multiple ways in which the data can be represented and multiple values to doing it in different ways. Inexperience or naivety in this aspect of data analysis can lead to many erroneous conclusions. Only a few of the current software tools take data analysis through to include a visualization step (21, 24, 25). The simplest two-dimensional visualization comes from deuterium incorporation plots (Figures 5B and 6). These plots are informative as they can provide information about dynamics and solvent accessibility. All of the HX-MS data that are contained in the deuterium incorporation plots can be translated into other two- and three dimensional figures in order to describe the HX-MS data in context of the whole protein or protein system. A partial list of all types of figures that can be created include: heat maps where deuterium levels are plotted onto peptide maps; 3-D models where deuterium levels are plotted onto the NMR or X-ray crystal structure cartoon model of the protein if it is available; difference plots where when acquiring data for the protein of interest in two or more different states, the difference between the two states is shown [e.g., comparability plots (49), or various kinds of difference plots (53, 54), (28)]. Visualizing where in the protein deuterium has gone, or not gone, or where it has gone differently in the case of comparisons, is vital to interpretation of the data.
3.7 HX-MS data interpretation
Data interpretation is the part of the HX-MS experiment that experiences the most variability; however, this topic is beyond the scope of this chapter. As a start, a description of the possible deuterium incorporation plots that can be encountered when performing an HX-MS experiment was recently described ([Figure 8 in Morgan & Engen (6)]. The plots that are shown in this figure are examples of most if not all of types of curves that can be found with a deuterium incorporation plot and importantly what various shapes in deuterium incorporation plots mean. The discussion surrounding this figure encompasses a single protein experiment as well as for one that investigates the result of a protein being in an “excited” or “perturbed” state through modification of the native equilibrium.
4. Notes
1. Overlapping isotope distributions
Overlapping isotope distributions are a frequent problem in HX-MS analyses of large proteins and protein complexes. Where there are a lot of peaks that must fit within limited peak capacity, overlap is inevitable. Often peptides will appear in multiple charge states, so if a protein’s isotope distribution is obscured by overlap in one charge state, analysis can often be done by examining alternative charge states. However sometimes no other charge states are available, or there is just so much protein loaded on the system that all available charges are also obscured and one is unable to obtain a satisfactory HX measurement. In these situations, the user can choose to extend the chromatographic separation in an effort to resolve the peptides; however this will be at the expense of increased back exchange. Another option with high resolution mass spectrometers is to use deconvolution methods to extract overlapping signals from one another (55, 56).
Some researchers are turning to ion mobility to help resolve overlapping isotope distributions (57) wherein an ion mobility separation occurs post ionization but before ion detection. If there is a sufficient difference between the peptides such that they are resolved via mobility, their overlap in spectral space becomes resolvable. For instruments capable of performing ion mobility separations, using this feature can help obtain measurements for protein systems that might otherwise prove difficult on traditional instrumentation.
Performing post-ionization fragmentation during local analysis experiments can also be beneficial in order to locate individual deuterium atoms within a peptic peptide. If peptide fragments are generated via collision induced dissociation, the fragments will not yield any further localization information due to scrambling of deuterium across the ion during gas-phase collisions (58–60). Some researchers are investigating the use of peptide fragments produced by electron transfer dissociation to even further localize uptake information. It has been shown that by using carefully tuned ETD conditions, deuterium scrambling can be minimized, allowing at times single amino acid resolution of uptake information if fragment data are considered (61–63). These experiments however are not yet commonplace, especially when LC separations are required.
2. Plotting HX-MS data for peptides with EX1 kinetics
For the majority of this article, we have only considered how to process HX-MS data in which the isotope distributions indicated EX2 kinetics. EX1 kinetics generally are rare for proteins maintained under physiological conditions. However, this kinetic limit is a possibility and processing of EX1 data is not as straightforward as processing EX2 data (43). Figure 7A–D illustrates four possible ways in which EX1 could manifest itself in the raw m/z or transformed mass spectra. EX1 can appear as either two discreet peaks or Gaussian distributions of isotopes (Figure 7A) or a combination of the two in varying degrees of overlap (Figure 7B–D). Unfortunately, there is no consensus for the manner in which EX1 HDX data should be presented on the deuterium incorporation plot. Traditionally, if the centers of the two peaks are resolved (Figure 7A and B) the deuterium incorporation data can be plotted for each peak (Figure 7E). Here, the relative deuterium levels of each separate peak are be plotted on the same axes, and there will be two data points for each time point where centroid values for the two populations are measurable.
Figure 7.

Manifestation of EX1 kinetics in m/z spectra. The merging of two binomial isotopic distributions of equal width but varying centers (in m/z units) are shown in (A–D). The separated distributions are shown on the left and the merged shown on the right. The centroid of the lower-mass distribution (no EX1 unfolding) is indicated by the filled diamond and that of the higher-mass distribution (EX1 unfolding and deuteration) is indicated with the filled square. As a visual aid, the solid bar is set at 20% maximum peak intensity and the open bar at 50% maximum peak intensity. (E) Model data plotted assuming the isotope patterns shown in (A) and (B). The data color and shape of the data points coordinate with those that are indicated on the isotope patterns in both (A) and (B). (F) Model data plotted assuming (C). Parts of this figure have been reproduced from Weis et al., 2006, with permission from Springer (reference number 500661560).
It is also possible that the isotope peaks for the two populations are too close for two resolved peak centers; there is simply evidence of isotopic peak widening (Figure 7C) or peak tailing (Figure 7D). In this case, significant evidence that there is EX1 kinetics comes from the creation of a peak width plot (40). This plot is created by measuring the absolute width (usually at 20% height) of the isotopic distribution versus deuterium exposure time. If there is a difference in width across the time course [>4 Da for intact protein and >2 Da for peptides, see (43)] this is evidence for EX1 kinetics. For these data the centroid value over the entire widened isotope distribution is plotted versus deuterium exposure time (Figure 7F).
3. Peptide carry-over in the LC step
Run-to-run carry-over sometimes cannot be avoided. “sticky” peptides that are retained on reversed-phase media can persist into the next exchange sample that is being analyzed. Carry-over can cause two complications with data analysis: the amount of deuterium incorporated into the persistent peptide cannot be accurately determined, and/or there is false EX1. Run to run carryover within the LC system has been shown to mimic EX1 kinetic data (64). In HX-MS data analysis it is best to minimize the amount of carryover either through loading a smaller amount of protein into the system, or efficient system washing in between analyte sample runs. There are published methods that have been designed to reduce the amount of peptide carryover (64). If there are indications that the analyte protein might be exhibiting EX1 kinetics, it is important that blank injections be performed in between samples to confirm the presence of EX1 and not simply the presence of peptide carry-over.
4. Calculation of theoretical maximum exchangeable backbone amide hydrogens
The maximum number of exchangeable backbone amide hydrogens in a peptide or protein (N) is calculated using equation 9 (10):
| (9) |
Where Lpeptide is the length of the peptide and npro is the number of proline residues. The subtraction of 1 in the above equation arises from the fast exchange of the primary amine at the N-terminus of a protein or peptide and the resulting loss of the deuterium label in the reversed-phase separation step. However, depending upon the amino acids bordering the penultimate amino acid the rate of exchange for this amide hydrogen also can be rapid (65, 66). Subsequently, there will also be a loss of the deuterium label at this position in the LC-MS step. In these instances, the subtraction should be 2 instead of one in the above equation.
Acknowledgments
The authors’ work with HX MS is supported by the NIH (R01-GM086507) and the Waters Corporation
References
- 1.Chowdhury SK, Katta V, Chait BT. Probing Conformational-Changes in Proteins by Mass-Spectrometry. J Am Chem Soc. 1990;112(24):9012–9013. [Google Scholar]
- 2.Katta V, Chait BT. Conformational-Changes in Proteins Probed by Hydrogen-Exchange Electrospray-Ionization Mass-Spectrometry. Rapid Commun Mass Sp. 1991;5(4):214–217. doi: 10.1002/rcm.1290050415. [DOI] [PubMed] [Google Scholar]
- 3.Smith DL, Deng YZ, Zhang ZQ. Probing the non-covalent structure of proteins by amide hydrogen exchange and mass spectrometry. J Mass Spectrom. 1997;32(2):135–146. doi: 10.1002/(SICI)1096-9888(199702)32:2<135::AID-JMS486>3.0.CO;2-M. [DOI] [PubMed] [Google Scholar]
- 4.Hoofnagle AN, Resing KA, Ahn NG. Protein analysis by hydrogen exchange mass spectrometry. Annu Rev Biophys Biomol Struct. 2003;32:1–25. doi: 10.1146/annurev.biophys.32.110601.142417. [DOI] [PubMed] [Google Scholar]
- 5.Wales TE, Engen JR. Hydrogen exchange mass spectrometry for the analysis of protein dynamics. Mass Spectrom Rev. 2006;25(1):158–170. doi: 10.1002/mas.20064. [DOI] [PubMed] [Google Scholar]
- 6.Morgan CR, Engen JR. Investigating solution-phase protein structure and dynamics by hydrogen exchange mass spectrometry. Curr Protoc Protein Sci. 2009;Chapter 17(Unit 17 16):11–17. doi: 10.1002/0471140864.ps1706s58. [DOI] [PMC free article] [PubMed] [Google Scholar]
- 7.Konermann L, Pan JX, Liu YH. Hydrogen exchange mass spectrometry for studying protein structure and dynamics. Chem Soc Rev. 2011;40(3):1224–1234. doi: 10.1039/c0cs00113a. [DOI] [PubMed] [Google Scholar]
- 8.Hvidt A, Nielsen SO. Hydrogen exchange in proteins. Adv Protein Chem. 1966;21:287–386. doi: 10.1016/s0065-3233(08)60129-1. [DOI] [PubMed] [Google Scholar]
- 9.Englander SW, Downer NW, Teitelbaum H. Hydrogen exchange. Annu Rev Biochem. 1972;41:903–924. doi: 10.1146/annurev.bi.41.070172.004351. [DOI] [PubMed] [Google Scholar]
- 10.Zhang ZQ, Smith DL. Determination of Amide Hydrogen-Exchange by Mass-Spectrometry - a New Tool for Protein-Structure Elucidation. Protein Sci. 1993;2(4):522–531. doi: 10.1002/pro.5560020404. [DOI] [PMC free article] [PubMed] [Google Scholar]
- 11.Engen JR. Analysis of protein complexes with hydrogen exchange and mass spectrometry. Analyst. 2003;128(6):623–628. doi: 10.1039/b212800b. [DOI] [PubMed] [Google Scholar]
- 12.Brier S, Lemaire D, DeBonis S, et al. Molecular dissection of the inhibitor binding pocket of mitotic kinesin Eg5 reveals mutants that confer resistance to antimitotic agents. J Mol Biol. 2006;360(2):360–376. doi: 10.1016/j.jmb.2006.04.062. [DOI] [PubMed] [Google Scholar]
- 13.Iacob RE, Engen JR. Hydrogen exchange mass spectrometry: Are we out of the quicksand? J Am Soc Mass Spectrom. 2012 doi: 10.1007/s13361-012-0377-z. (Invited ‘Critical insight’). in press. [DOI] [PMC free article] [PubMed] [Google Scholar]
- 14.Weis DD, Engen JR, Kass IJ. Semi-automated data processing of hydrogen exchange mass spectra using HX-Express. J Am Soc Mass Spectrom. 2006;17(12):1700–1703. doi: 10.1016/j.jasms.2006.07.025. [DOI] [PubMed] [Google Scholar]
- 15.Miller DE, Prasannan CB, Villar MT, et al. HDXFinder: automated analysis and data reporting of deuterium/hydrogen exchange mass spectrometry. J Am Soc Mass Spectrom. 2012;23(2):425–429. doi: 10.1007/s13361-011-0234-5. [DOI] [PMC free article] [PubMed] [Google Scholar]
- 16.Slysz GW, Baker CA, Bozsa BM, et al. Hydra: software for tailored processing of H/D exchange data from MS or tandem MS analyses. Bmc Bioinformatics. 2009;10:1–14. doi: 10.1186/1471-2105-10-162. [DOI] [PMC free article] [PubMed] [Google Scholar]
- 17.Lou X, Kirchner M, Renard BY, et al. Deuteration distribution estimation with improved sequence coverage for HX/MS experiments. Bioinformatics. 2010;26(12):1535–1541. doi: 10.1093/bioinformatics/btq165. [DOI] [PubMed] [Google Scholar]
- 18.Kreshuk A, Stankiewicz M, Lou XH, et al. Automated detection and analysis of bimodal isotope peak distributions in H/D exchange mass spectrometry using HeXicon. Int J Mass Spectrom. 2011;302(1–3):125–131. [Google Scholar]
- 19.Palmblad M, Buijs J, Hakansson P. Automatic analysis of hydrogen/deuterium exchange mass spectra of peptides and proteins using calculations of isotopic distributions. J Am Soc Mass Spectrom. 2001;12(11):1153–1162. doi: 10.1016/S1044-0305(01)00301-4. [DOI] [PubMed] [Google Scholar]
- 20.Kavan D, Man P. MSTools-Web based application for visualization and presentation of HXMS data. Int J Mass Spectrom. 2011;302(1–3):53–58. [Google Scholar]
- 21.Pascal BD, Chalmers MJ, Busby SA, et al. HD Desktop: An Integrated Platform for the Analysis and Visualization of H/D Exchange Data. J Am Soc Mass Spectr. 2009;20(4):601–610. doi: 10.1016/j.jasms.2008.11.019. [DOI] [PMC free article] [PubMed] [Google Scholar]
- 22.Pascal BD, Chalmers MJ, Busby SA, et al. The Deuterator: software for the determination of backbone amide deuterium levels from H/D exchange MS data. Bmc Bioinformatics. 2007;8:156. doi: 10.1186/1471-2105-8-156. [DOI] [PMC free article] [PubMed] [Google Scholar]
- 23.Liu SM, Liu LT, Uzuner U, et al. HDX-Analyzer: a novel package for statistical analysis of protein structure dynamics. Bmc Bioinformatics. 2011;12(Supp1):S43. doi: 10.1186/1471-2105-12-S1-S43. [DOI] [PMC free article] [PubMed] [Google Scholar]
- 24.Hamuro Y, Coales SJ, Southern MR, et al. Rapid analysis of protein structure and dynamics by hydrogen/deuterium exchange mass spectrometry. J Biomol Tech. 2003;14(3):171–182. [PMC free article] [PubMed] [Google Scholar]
- 25.Wei H, Ahn J, Yu YQ, et al. Using Hydrogen/Deuterium Exchange Mass Spectrometry to Study Conformational Changes in Granulocyte Colony Stimulating Factor upon PEGylation. J Am Soc Mass Spectrom. 2012;23(3):498–504. doi: 10.1007/s13361-011-0310-x. [DOI] [PMC free article] [PubMed] [Google Scholar]
- 26.Wales TE, Fadgen KE, Gerhardt GC, et al. High-speed and high-resolution UPLC separation at zero degrees Celsius. Anal Chem. 2008;80(17):6815–6820. doi: 10.1021/ac8008862. [DOI] [PMC free article] [PubMed] [Google Scholar]
- 27.Engen JR, Smith DL. Investigating the higher order structure of proteins. Hydrogen exchange, proteolytic fragmentation, and mass spectrometry. Methods Mol Biol. 2000;146:95–112. doi: 10.1385/1-59259-045-4:95. [DOI] [PubMed] [Google Scholar]
- 28.Tiyanont K, Wales TE, Aste-Amezaga M, et al. Evidence for Increased Exposure of the Notch1 Metalloprotease Cleavage Site upon Conversion to an Activated Conformation. Structure. 2011;19(4):546–554. doi: 10.1016/j.str.2011.01.016. [DOI] [PMC free article] [PubMed] [Google Scholar]
- 29.Ehring H. Hydrogen exchange electrospray ionization mass spectrometry studies of structural features of proteins and protein/protein interactions. Anal Biochem. 1999;267(2):252–259. doi: 10.1006/abio.1998.3000. [DOI] [PubMed] [Google Scholar]
- 30.Woods VL., Jr Methods for the high-resolution identification of solvent-accessible amide hydrogens in polypeptides or proteins and for characterization of the fine structure of protein binding sites. 6,291,189 US Patent. 2001
- 31.Cravello L, Lascoux D, Forest E. Use of different proteases working in acidic conditions to improve sequence coverage and resolution in hydrogen/deuterium exchange of large proteins. Rapid Commun Mass Spectrom. 2003;17(21):2387–2393. doi: 10.1002/rcm.1207. [DOI] [PubMed] [Google Scholar]
- 32.Wang L, Pan H, Smith DL. Hydrogen exchange-mass spectrometry: optimization of digestion conditions. Mol Cell Proteomics. 2002;1(2):132–138. doi: 10.1074/mcp.m100009-mcp200. [DOI] [PubMed] [Google Scholar]
- 33.Johnson RS, Walsh KA. Mass-Spectrometric Measurement of Protein Amide Hydrogen-Exchange Rates of Apo-Myoglobin and Holo-Myoglobin. Protein Sci. 1994;3(12):2411–2418. doi: 10.1002/pro.5560031224. [DOI] [PMC free article] [PubMed] [Google Scholar]
- 34.Wu Y, Engen JR, Hobbins WB. Ultra performance liquid chromatography (UPLC) further improves hydrogen/deuterium exchange mass spectrometry. J Am Soc Mass Spectr. 2006;17(2):163–167. doi: 10.1016/j.jasms.2005.10.009. [DOI] [PubMed] [Google Scholar]
- 35.Mandell JG, Falick AM, Komives EA. Identification of protein-protein interfaces by decreased amide proton solvent accessibility. Proc Natl Acad Sci U S A. 1998;95(25):14705–14710. doi: 10.1073/pnas.95.25.14705. [DOI] [PMC free article] [PubMed] [Google Scholar]
- 36.Dharmasiri K, Smith DL. Mass spectrometric determination of isotopic exchange rates of amide hydrogens located on the surfaces of proteins. Anal Chem. 1996;68(14):2340–2344. doi: 10.1021/ac9601526. [DOI] [PubMed] [Google Scholar]
- 37.Rosa JJ, Richards FM. An experimental procedure for increasing the structural resolution of chemical hydrogen-exchange measurements on proteins: application to ribonuclease S peptide. J Mol Biol. 1979;133(3):399–416. doi: 10.1016/0022-2836(79)90400-5. [DOI] [PubMed] [Google Scholar]
- 38.Englander JJ, Rogero JR, Englander SW. Protein hydrogen exchange studied by the fragment separation method. Anal Biochem. 1985;147(1):234–244. doi: 10.1016/0003-2697(85)90033-8. [DOI] [PMC free article] [PubMed] [Google Scholar]
- 39.Marcsisin SR, Engen JR. Hydrogen exchange mass spectrometry: what is it and what can it tell us? Anal Bioanal Chem. 2010;397(3):967–972. doi: 10.1007/s00216-010-3556-4. [DOI] [PMC free article] [PubMed] [Google Scholar]
- 40.Weis DD, Wales TE, Engen JR, et al. Identification and characterization of EX1 kinetics in H/D exchange mass spectrometry by peak width analysis. J Am Soc Mass Spectr. 2006;17(11):1498–1509. doi: 10.1016/j.jasms.2006.05.014. [DOI] [PubMed] [Google Scholar]
- 41.Kipping M, Schierhorn A. Improving hydrogen/deuterium exchange mass spectrometry by reduction of the back-exchange effect. J Mass Spectrom. 2003;38(3):271–U278. doi: 10.1002/jms.437. [DOI] [PubMed] [Google Scholar]
- 42.Hoofnagle AN, Resing KA, Ahn NG. Practical methods for deuterium exchange/mass spectrometry. Methods Mol Biol. 2004;250:283–298. doi: 10.1385/1-59259-671-1:283. [DOI] [PubMed] [Google Scholar]
- 43.Weis DD, Wales TE, Engen JR, et al. Identification and characterization of EX1 kinetics in H/D exchange mass spectrometry by peak width analysis. J Am Soc Mass Spectrom. 2006;17(11):1498–1509. doi: 10.1016/j.jasms.2006.05.014. [DOI] [PubMed] [Google Scholar]
- 44.Englander SW, Kallenbach NR. Hydrogen exchange and structural dynamics of proteins and nucleic acids. Q Rev Biophys. 1983;16(4):521–655. doi: 10.1017/s0033583500005217. [DOI] [PubMed] [Google Scholar]
- 45.Miranker A, Robinson CV, Radford SE, et al. Detection of Transient Protein-Folding Populations by Mass-Spectrometry. Science. 1993;262(5135):896–900. doi: 10.1126/science.8235611. [DOI] [PubMed] [Google Scholar]
- 46.Fruton JS, Bergmann M. The Specificity of Pepsin Action. 1938;87(2268):557. doi: 10.1126/science.87.2268.557. [DOI] [PubMed] [Google Scholar]
- 47.Geromanos SJ, Vissers JP, Silva JC, et al. The detection, correlation, and comparison of peptide precursor and product ions from data independent LC-MS with data dependant LC-MS/MS. Proteomics. 2009;9(6):1683–1695. doi: 10.1002/pmic.200800562. [DOI] [PubMed] [Google Scholar]
- 48.Zhang Z, Marshall AG. A universal algorithm for fast and automated charge state deconvolution of electrospray mass-to-charge ratio spectra. J Am Soc Mass Spectrom. 1998;9(3):225–233. doi: 10.1016/S1044-0305(97)00284-5. [DOI] [PubMed] [Google Scholar]
- 49.Houde D, Berkowitz SA, Engen JR. The utility of hydrogen/deuterium exchange mass spectrometry in biopharmaceutical comparability studies. J Pharm Sci. 2011;100(6):2071–2086. doi: 10.1002/jps.22432. [DOI] [PMC free article] [PubMed] [Google Scholar]
- 50.Tsutsui Y, Liu L, Gershenson A, et al. The conformational dynamics of a metastable serpin studied by hydrogen exchange and mass spectrometry. Biochem. 2006;45(21):6561–6569. doi: 10.1021/bi060431f. [DOI] [PubMed] [Google Scholar]
- 51.Zheng X, Wintrode PL, Chance MR. Complementary structural mass spectrometry techniques reveal local dynamics in functionally important regions of a metastable serpin. Structure. 2008;16(1):38–51. doi: 10.1016/j.str.2007.10.019. [DOI] [PubMed] [Google Scholar]
- 52.Busenlehner LS, Armstrong RN. Insights into enzyme structure and dynamics elucidated by amide H/D exchange mass spectrometry. Arch Biochem Biophys. 2005;433(1):34–46. doi: 10.1016/j.abb.2004.09.002. [DOI] [PubMed] [Google Scholar]
- 53.Tsutsumi S, Mollapour M, Prodromou C, et al. Charged linker sequence modulates eukaryotic heat shock protein 90 (Hsp90) chaperone activity. P Natl Acad Sci USA. 2012;109(8):2937–2942. doi: 10.1073/pnas.1114414109. [DOI] [PMC free article] [PubMed] [Google Scholar]
- 54.Street TO, Lavery LA, Verba KA, et al. Cross-Monomer Substrate Contacts Reposition the Hsp90 N-Terminal Domain and Prime the Chaperone Activity. J Mol Biol. 2012;415(1):3–15. doi: 10.1016/j.jmb.2011.10.038. [DOI] [PMC free article] [PubMed] [Google Scholar]
- 55.Kazazic S, Zhang HM, Schaub TM, et al. Automated data reduction for hydrogen/deuterium exchange experiments, enabled by high-resolution Fourier transform ion cyclotron resonance mass spectrometry. J Am Soc Mass Spectrom. 2010;21(4):550–558. doi: 10.1016/j.jasms.2009.12.016. [DOI] [PMC free article] [PubMed] [Google Scholar]
- 56.Zhang Z, Li W, Logan TM, et al. Human recombinant [C22A] FK506-binding protein amide hydrogen exchange rates from mass spectrometry match and extend those from NMR. Protein Sci. 1997;6(10):2203–2217. doi: 10.1002/pro.5560061015. [DOI] [PMC free article] [PubMed] [Google Scholar]
- 57.Iacob RE, Murphy JP, 3rd, Engen JR. Ion mobility adds an additional dimension to mass spectrometric analysis of solution-phase hydrogen/deuterium exchange. Rapid Commun Mass Spectrom. 2008;22(18):2898–2904. doi: 10.1002/rcm.3688. [DOI] [PMC free article] [PubMed] [Google Scholar]
- 58.Demmers JA, Rijkers DT, Haverkamp J, et al. Factors affecting gas-phase deuterium scrambling in peptide ions and their implications for protein structure determination. J Am Chem Soc. 2002;124(37):11191–11198. doi: 10.1021/ja0125927. [DOI] [PubMed] [Google Scholar]
- 59.Jorgensen TJ, Gardsvoll H, Ploug M, et al. Intramolecular migration of amide hydrogens in protonated peptides upon collisional activation. J Am Chem Soc. 2005;127(8):2785–2793. doi: 10.1021/ja043789c. [DOI] [PubMed] [Google Scholar]
- 60.Jorgensen TJ, Bache N, Roepstorff P, et al. Collisional activation by MALDI tandem time-of-flight mass spectrometry induces intramolecular migration of amide hydrogens in protonated peptides. Mol Cell Proteomics. 2005;4(12):1910–1919. doi: 10.1074/mcp.M500163-MCP200. [DOI] [PubMed] [Google Scholar]
- 61.Zubarev RA, Kelleher NL, McLafferty FW. Electron capture dissociation of multiply charged protein cations. A nonergodic process. J Am Chem Soc. 1998;120(13):3265–3266. [Google Scholar]
- 62.Rand KD, Adams CM, Zubarev RA, et al. Electron capture dissociation proceeds with a low degree of intramolecular migration of peptide amide hydrogens. J Am Chem Soc. 2008;130(4):1341–1349. doi: 10.1021/ja076448i. [DOI] [PubMed] [Google Scholar]
- 63.Zehl M, Rand KD, Jensen ON, et al. Electron Transfer Dissociation Facilitates the Measurement of Deuterium Incorporation into Selectively Labeled Peptides with Single Residue Resolution. J Am Chem Soc. 2008;130(51):17453–17459. doi: 10.1021/ja805573h. [DOI] [PubMed] [Google Scholar]
- 64.Fang J, Rand KD, Beuning PJ, et al. False EX1 signatures caused by sample carryover during HX MS analyses. Int J Mass Spectrom. 2011;302(1–3):19–25. doi: 10.1016/j.ijms.2010.06.039. [DOI] [PMC free article] [PubMed] [Google Scholar]
- 65.Bai Y, Milne JS, Mayne L, et al. Primary structure effects on peptide group hydrogen exchange. 1993;17(1):75–86. doi: 10.1002/prot.340170110. [DOI] [PMC free article] [PubMed] [Google Scholar]
- 66.Connelly GP, Bai Y, Jeng MF, et al. Isotope effects in peptide group hydrogen exchange. 1993;17(1):87–92. doi: 10.1002/prot.340170111. [DOI] [PubMed] [Google Scholar]