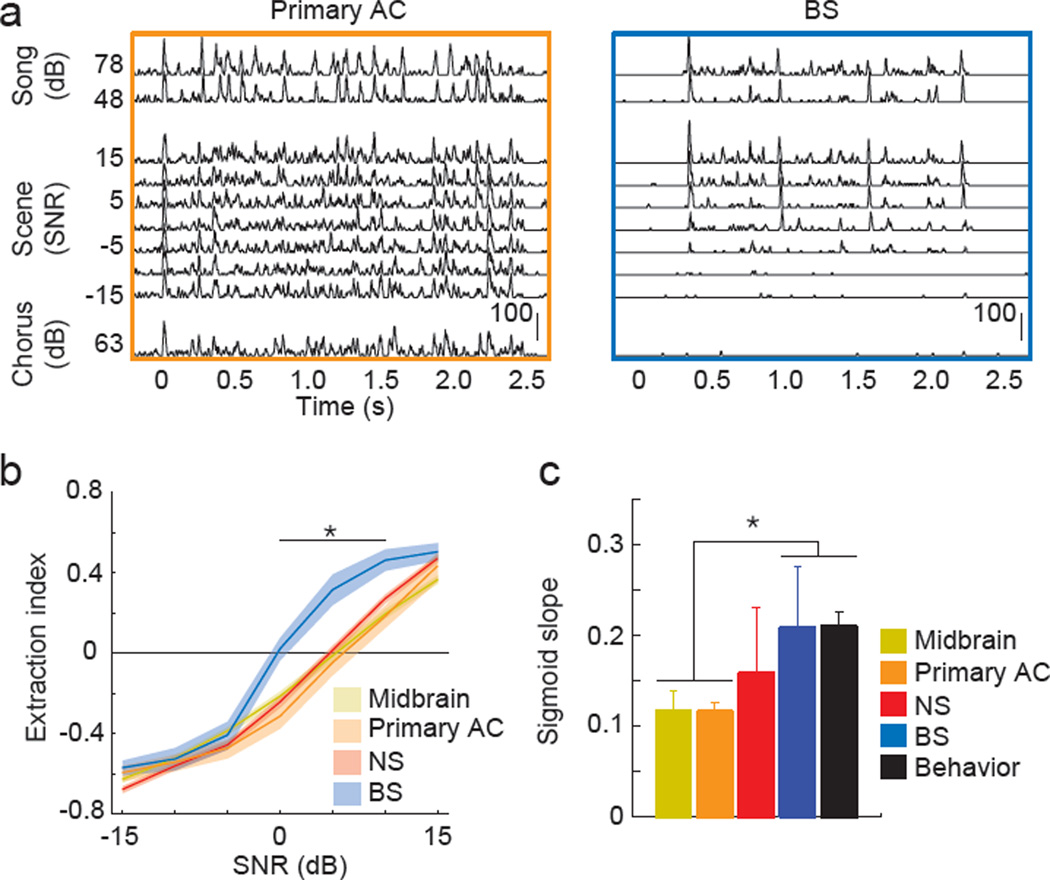
Figure 5. Background-invariant coding of auditory scenes.
(A) Example PSTHs from an individual primary AC neuron (left) and BS higher-level AC neuron (right) to a song at highest and lowest intensity presented (top), to chorus (bottom) and to auditory scenes (middle). Scale bars show firing rate (Hz). (B) Extraction index shows the degree to which the response to auditory scenes was similar to the song response (positive numbers, +1 being identical) or the chorus response (negative numbers, −1 being identical). Solid lines show mean and shaded areas show +/−SEM. Asterisks indicate SNRs where BS neurons are significantly different than all other areas (p < 0.05, Kruskal-Wallis). (C) Slope of logistic fits of extraction index curves and psychometric functions.

