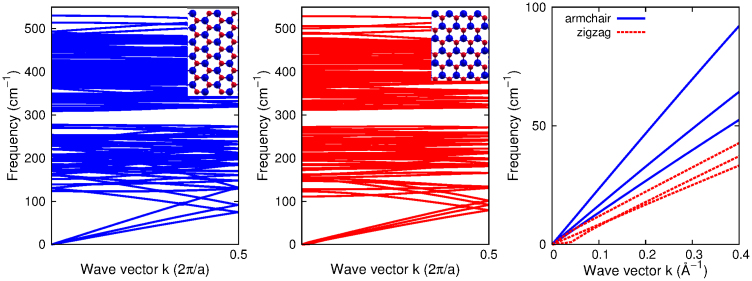
Figure 2. Phonon dispersion in armchair (left) and zigzag (middle) MSNRs.
Insets show the unit cells used in the calculation of the phonon spectrum. The three acoustic phonon branches in armchair and zigzag systems are compared in the right panel. We note the band gap around 200 cm−1 in the spectrum.

