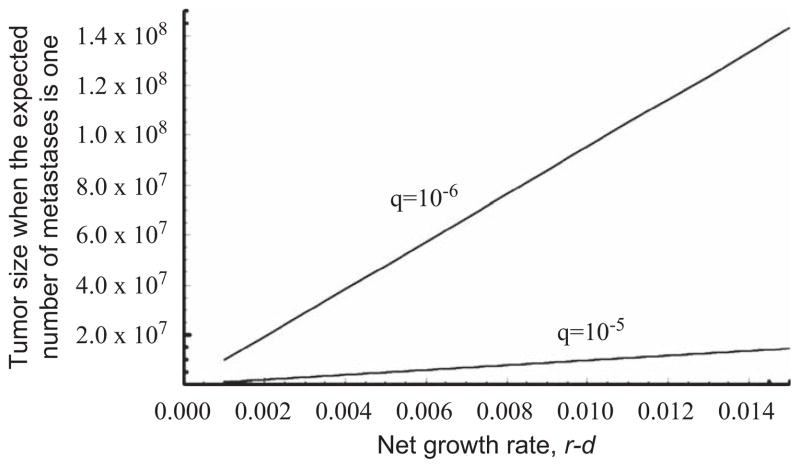
Fig. 10.
Tumor size at the time of the first metastatic dissemination. The figure shows the tumor size when the expected number of metastatic sites is one. Parameter values are d = b1 = b2 = 0.001 and u = 10−5. Growth rates vary between r = a1 = a2 = 0.002 and r = a1 = a2 = 0.016. Results using two values for the rate of metastatic dissemination, q, are shown.

