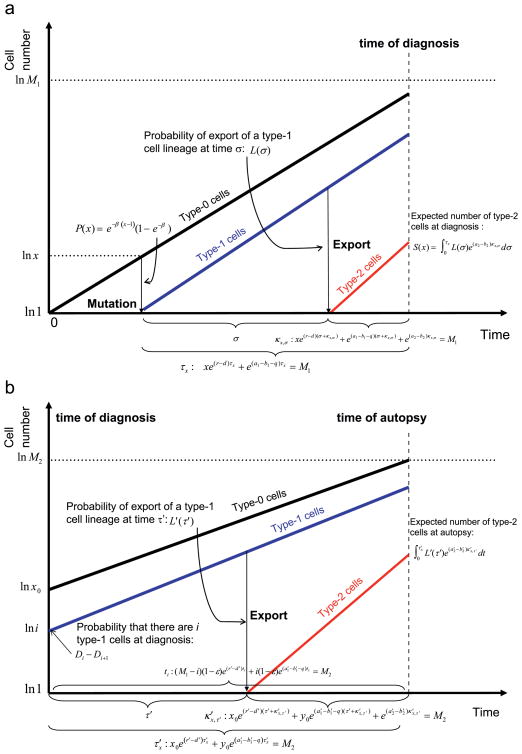
Fig. 2.
Schematic illustration of the analytical approximations. The figure shows the mathematical expressions used for the derivation of the analytical approximation. (a) Schema of the derivation of the three quantities at diagnosis. We first consider the probability that a type-1 cell arises when there are x type-0 cells, P(x). Next we consider the probability and expected number of export events of type-1 cells during τx (these quantities except τx and P(x) are not shown). In order to obtain the total number of metastatic cells, the probability of export at time σ is calculated as L(σ). The length of time between export and diagnosis is expressed as κx,σ. The number of type-2 cells after this time is deterministically calculated. (b) Schema of the derivation of the three quantities at autopsy. We first consider the probability that there are i type-1 cells at diagnosis, Di − Di+1. Then the probability and the expected number of export events of type-1 cells until autopsy are calculated (these quantities except ti, which represents the amount of time between diagnosis and autopsy, are not shown). The derivation of the approximation for the case in which there are no type-1 cells at diagnosis is not shown for simplicity. In order to obtain the total number of metastatic cells, the probability of export at time τ′ after the diagnosis is calculated as L′(τ′), where the lineage of type-1 cells emerged when there were x type-0 cell. The length of time between export and autopsy is expressed as κ′x,τ′. The number of type-2 cells after this time is deterministically calculated. The case where type-2 cells exist at the time of diagnosis is not shown. The black line represents the growth of type-0 cells, the blue line that of type-1 cells, and the red line that of type-2 cells.

