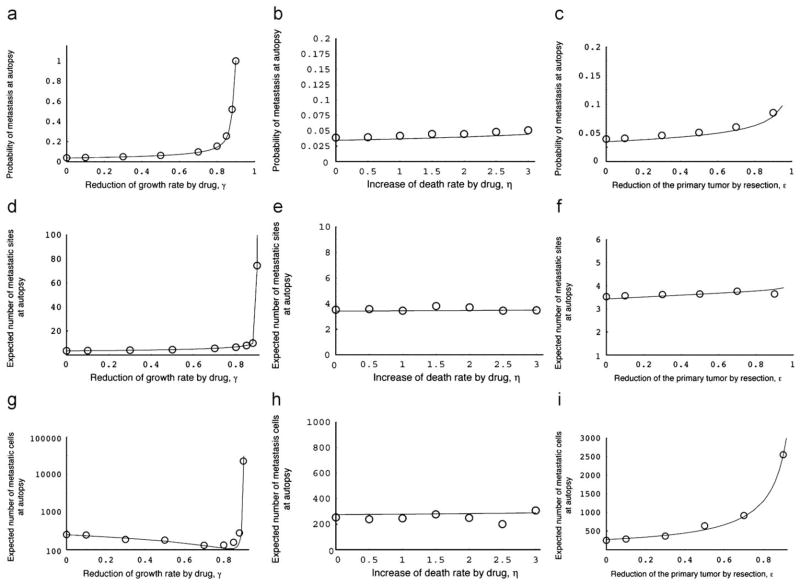
Fig. 6.
Three quantities at autopsy with treatment. (a)–(c) The panels show the dependence of the probability of metastasis at autopsy on the two treatment strategies. The curves indicate the predictions of the analytical approximations, Eq. (7), while the circles indicate the results of the direct computer simulation, system (1). Parameter values are (a) M1 = 250 000, M2 = 1 000 000, r = 0.011, a1 = 0.016, a2 = 0.021, d = b1 = b2 = 0.001, u = 10−5, q = 10−6, and ε = η = 0.0; (b) ε = γ = 0.0; and (c) γ = η = 0.0. (d)–(f) The panels show the dependence of the expected number of metastatic sites at autopsy on the two treatment strategies. The curves indicate the predictions of the analytical approximations, Eq. (8), while the circles indicate the results of the direct computer simulations, system (1). Parameter values are as above. (e)–(g) The panels show the dependence of the expected total number of metastatic cells at autopsy on the two treatment strategies. The curves indicate the predictions of the analytical approximations, Eq. (9), while the circles indicate the results of the direct computer simulations, system (1). Parameter values are as above.

