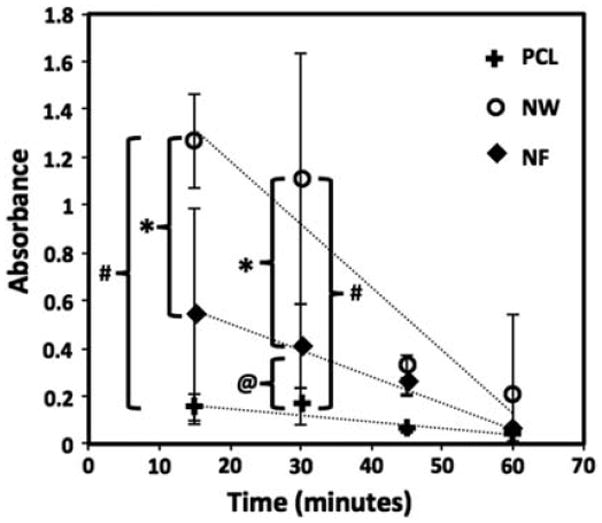
Figure 11.

Free hemoglobin concentration determined in terms of its absorbance on PCL, NW and NF surfaces for 60min of clotting time. Significant differences in free hemogloblin concentrations after 15mins on NW and NF surfaces, and NW and PCL surfaces (*, # → p < 0.05). Significant differences in few hemogblobin concentrations after 30mins on all surfaces (*, # and @ → p < 0.05).
