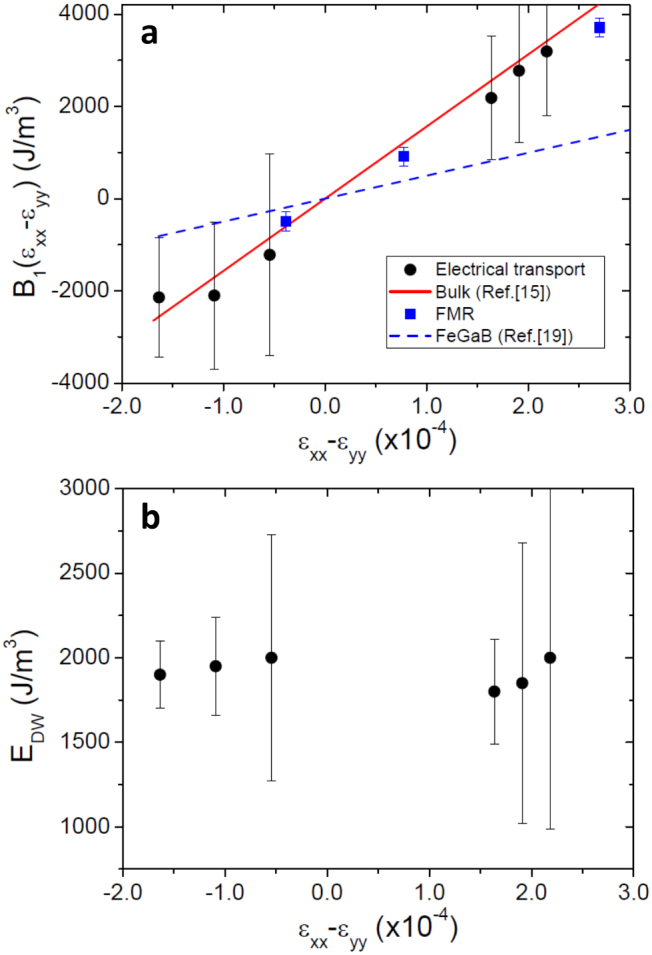
Figure 2. Measured magnetoelastic and domain wall energies.

(a) The magnetic free energy coefficient induced by the strain for the epitaxial thin Fe81Ga19 films obtained from electrical transport (black circles) and FMR measurements (blue squares). For comparison the curves deduced from the numbers reported for bulk single crystals (solid red line)15 and thin FeGaB (dashed blue line) films19 are also shown. (b) The domain wall pinning energy extracted from fitting to the electrical transport measurements.
