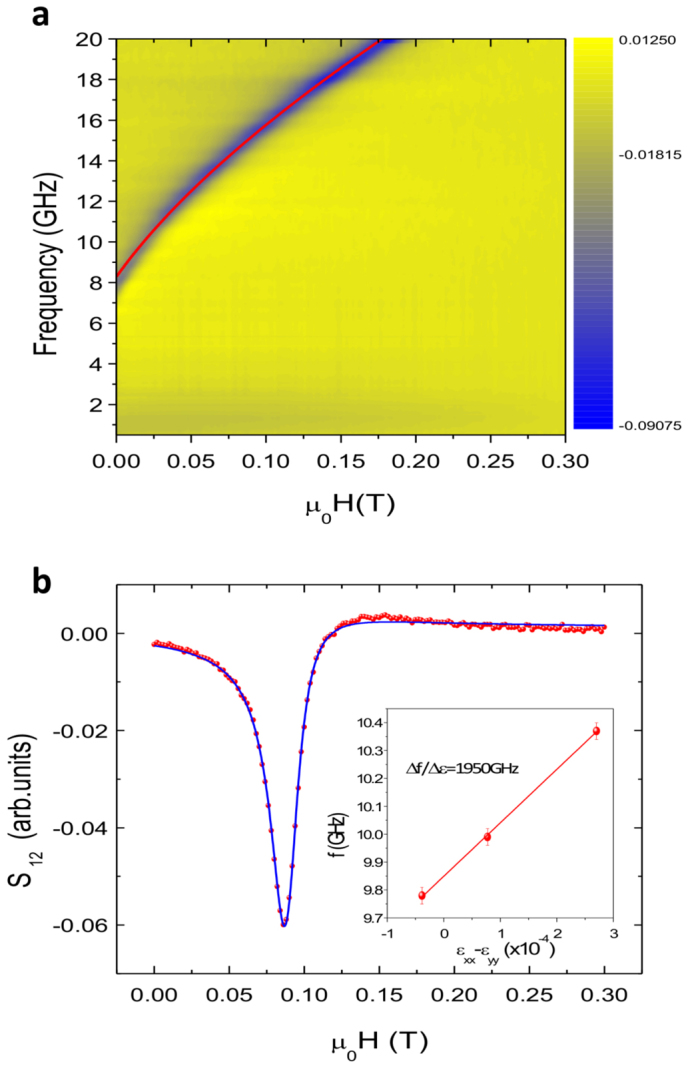
Figure 3. Ferromagnetic resonance.

(a) Frequency vs magnetic field map of absorbed microwave power (VNA S12) for the magnetic field applied along the [100] easy axis. The Kittel resonance can be clearly identified. The red line represents the theoretical curve. (b) The microwave transmission vs magnetic field measured from a line scan through (a) at a frequency of 15 GHz. The data (red dots) are fitted to an asymmetric peak function (blue line) allowing the linewidth, defined as the half width at half maximum, to be extracted. Inset shows the resonant frequency as a function of applied strain for μ0H = 20 mT applied along the [010] direction.
