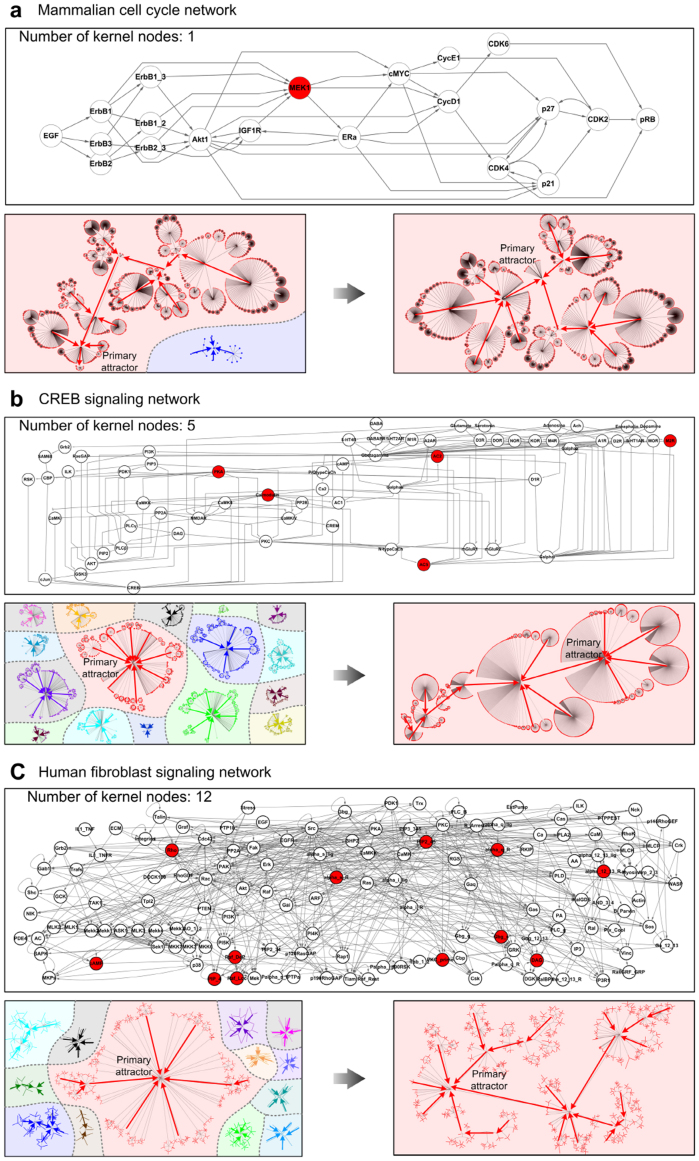
Figure 3. Examples of larger biomolecular regulatory networks and their state transition diagrams before and after the regulation of control kernel nodes.
(a) Mammalian cell cycle network. (b) CREB signaling network. (c) Human fibroblast signaling network. In (a)–(c), the upper, lower left, and lower right panels show the original network with the control kernel denoted by red nodes, the state transition diagram of the original network, and the state transition diagram of the controlled network, respectively. In each state transition diagram, the same colored dots represent inclusion in the same basin of attraction.

