
Figure 1.
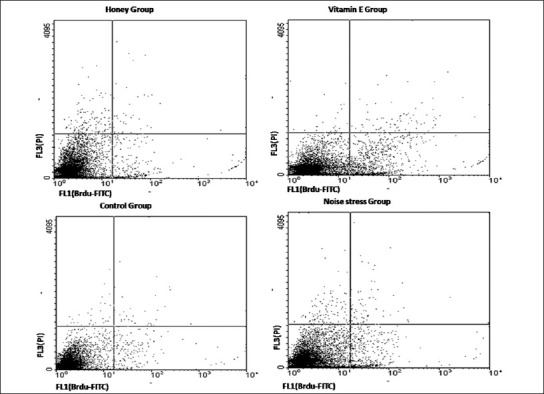
Flowcytometric study. Cells were analyzed for green fluorescence (FITC) and for red fluorescence (PI) by flow cytometry. Percentages of viable, apoptotic and necrotic testicular parenchyma cells were determined by the dot plot of FL1 (in the X axis) to FL3 (in the Y axis). Lower left indicates viability percent and lower right and upper right indicate percentage of apoptosis and necrosis respectively. The comparisons between cell cycle/apoptotic responses of Honey, Vitamin, Noise stress and control groups are showed.