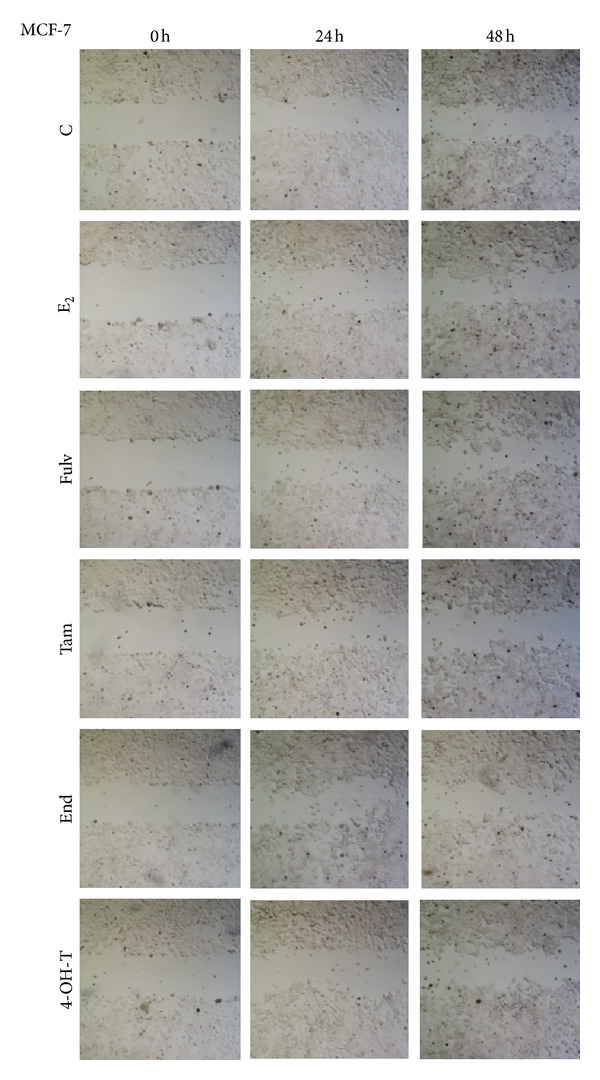
Figure 3.

Collective cell migration in MCF-7 cells treated with E2 and antiestrogens. C: control (untreated cells); E2: cells treated with 17β-estradiol; Fulv: cells treated with E2 + 100 nM Fulv; Tam: cells treated with E2 + 100 nM Tam; End: cells treated with E2 + 100 nM End; and 4-OH-T: cells treated with E2 + 100 nM 4-OH-T. The image is representative of three independent experiments using a magnification of 4X.
