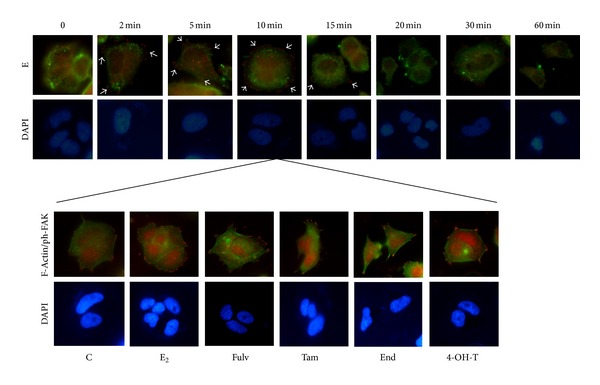
Figure 8.

The impact of E2 and the tested agents on Tyr397 FAK phosphorylation and F-actin rearrangement. MCF-7 cells exposed to E2 in a time course manner up to 60 min for detection of the maximum FAK phosphorylation. ERα and Tyr397 FAK localisation is indicated with green and red fluorescence, respectively. At the time point of 10 min, F-actin and Tyr397 FAK colocalisation (green and red fluorescence, resp.) was observed after the exposure of MCF-7 cells to the tested agents. C: control (untreated cells); E2: cells treated with 17β-estradiol; Fulv: cells treated with E2 + 100 nM Fulv; Tam: cells treated with E2 + 100 nM Tam; End: cells treated with E2 + 100 nM End; and 4-OH-T: cells treated with E2 + 100 nM 4-OH-T. The image is representative of three independent experiments using a magnification of 60X.
