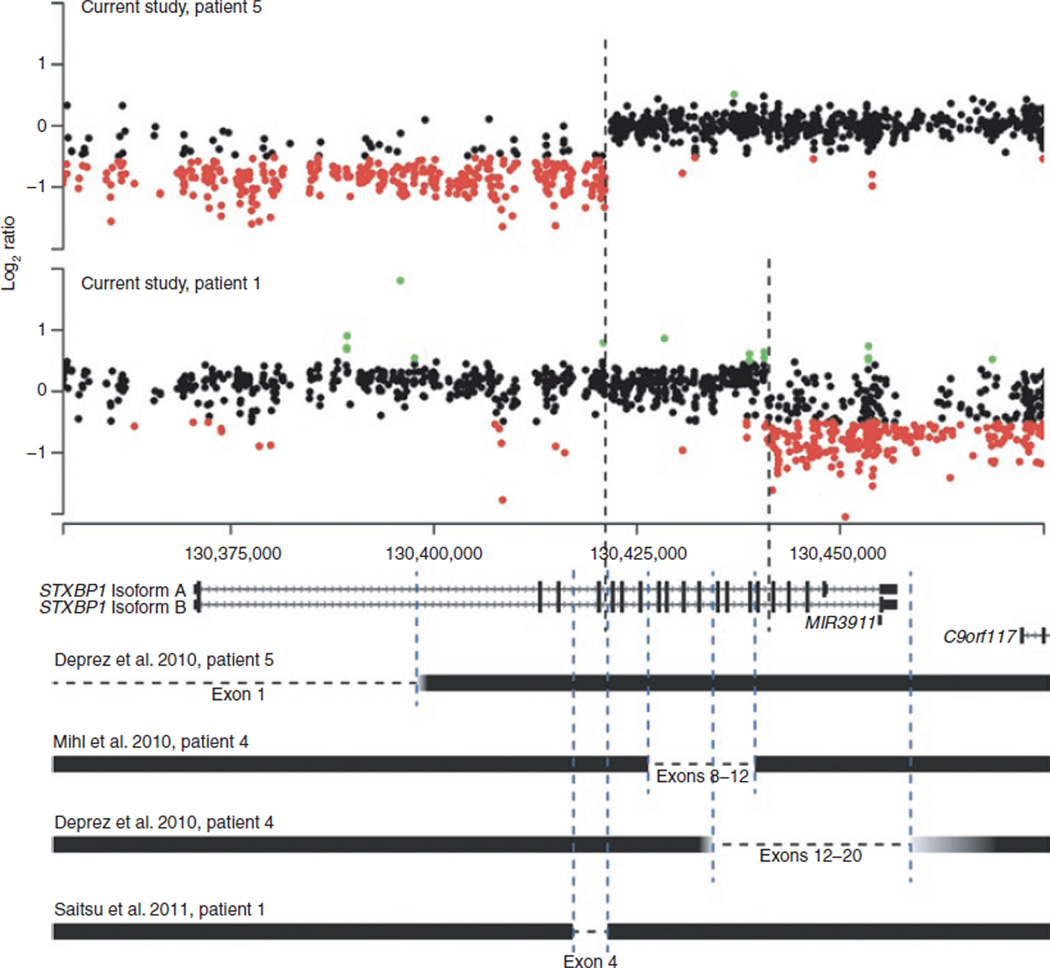
Figure 2. Single gene deletions of STXBP1 coding sequence.
Top, array comparative genomic hybridization analysis of the STXBP1, coding region in two patients from this study with partial deletions of STXBP1,. Middle, schematic representation of the two RefSeq isoforms of STXBP1,. Below, schematic representation of the deletions involving segments of the STXBP1, gene in four previously reported patients. Dashed lines represent the extent of the genomic deletion in the previous patients. Black horizontal bars represent nondeleted regions; gradient bars identify either uninformative or inconclusive areas.

