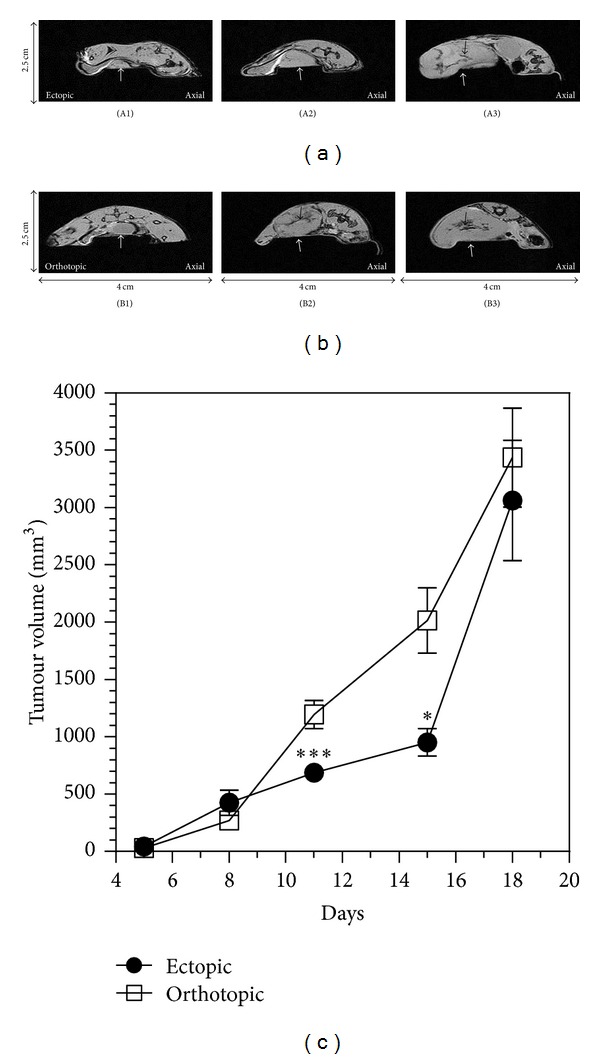
Figure 4.

T 2* weighted images showing the ectopic and orthotopic CT26 tumour. T 2* weighted imaging provides anatomical axial images of ectopic (a) and orthotopic model (b) at days 5, 11, and 15. White arrows indicate the tumour localisation. Black arrows show the hyposignal regions. (c) Evaluation of tumour volume with images quantification for ectopic and orthotopic model as a function of time.
